- The Professional Ticker Reader TM
- Your accurate, authentic and affordable guide to investing
Flavours of the week Aug 21, 2004
These are stocks that we expect to out-perform the markets. Cash and derivative strategies are advised thereon. Please stay online to enable loading of graphics from our servers. Please also read the trading tips section at the end of the newsletter.
|
Individual stocks. |
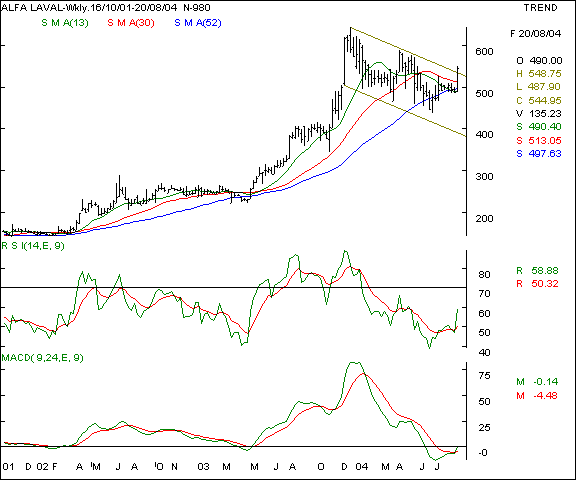
Alfa Laval - This scrip has been in a bearish channel after a spectacular run upwards. The counter has started trading above it's 52 week SMA and is attempting to breakout above the channel top. The confirmation of the breakout will be a close above the 550 mark with high volumes and a sustained closing above this level. The pattern would then be a flag formation, which depending on the strength of the breakout, will mean a price target of 610 in the short / medium term. We recommend a buy on bullish confirmation.
Your call of action -
-
Investors / cash segment players - buy the counter above a 550 sustained closing on high volumes with a stop loss at the 515 levels. Expect profit taking at the 600 in the medium term.
-
Aggressive F&O traders - derivatives n/a
-
Derivatives contract size - n/a.
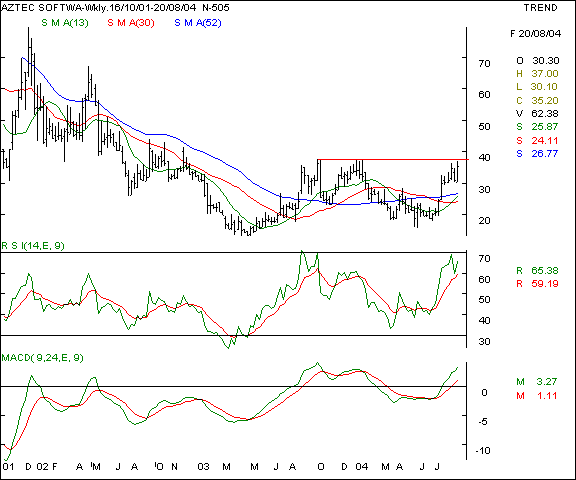
Aztec Software - This mid cap technology counter is showing signs of strength as the counter has rallied past it's short and long term SMA's and the momentum oscillators signal an upmove. The scrip is near it's congestion zone of a double top at the 39 levels, which needs to be surpassed with heavy volumes. Once these levels are surpassed, expect a fresh upmove.
Your call of action -
-
Investors / cash segment players - Buy this scrip in small lots above a closing of 39 levels with heavy volumes as a confirmatory signal. Hold with a stop loss of 34.40 and expect a target of 43 - 44 in a conducive market.
-
Aggressive F&O traders - F&O not available.
-
Derivatives contract size - F&O not available.
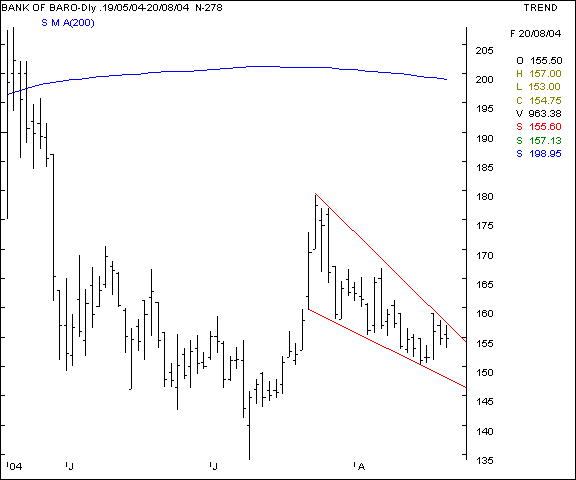
Bank of Baroda - the banking sector is under the bear hammer as the inflation worries, coupled with higher interest rates are threatening to erode the banks' gilts portfolio. This PSU banking major is making lower tops and bottoms formations with the bottoms falling slower than the tops. That gives this scrip a falling wedge formation which makes the outlook weak in the near term. We advocate short selling provided certain triggers are signalled on the charts.
Your call of action -
-
Investors / cash segment players - exit delivery based investments on major advances if any.
-
Aggressive F&O traders - Short the September futures below a price of 150 with a stop loss at the 153.50 mark and expect profit taking at the 143 - 145 levels.
-
Derivatives contract size - Market lot = 1,400 shares, F&O margins = approx Rs 50,000 ( subject to change daily ).
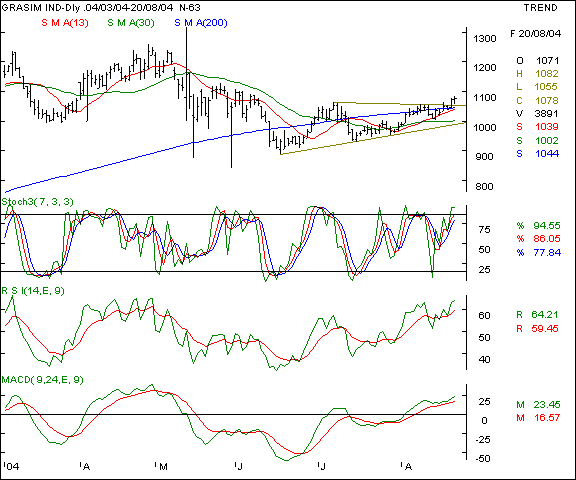
Grasim - This cement major was recommended in the recent weeks in this newsletter and has lived upto bullish expectations of our investors. The counter has signaled a bullish breakout above a rising wedge and that too good volumes. The oscillators are signaling a possibility of a further upmove as the momentum is likely to continue. Since a majority of our target on this scrip are achieved, we would advocate fresh buying only for the adventurous and high risk traders. That too in small lots only.
Your call of action -
-
Investors / cash segment players - Delivery based buyers are advocated to abstain from fresh purchases and hold their long positions, if any, with a target price of 1095 - 1100.
-
Aggressive F&O traders - Buy the September futures above the 1066 levels and hold with a stop loss at the 1054 levels. Expect profit booking at the 1085 - 1090 levels. As specified earlier, this trade should be initiated in small lots only.
-
Derivatives contract size - F&O contract size = 350 shares. F&O margins Approx Rs 60,000
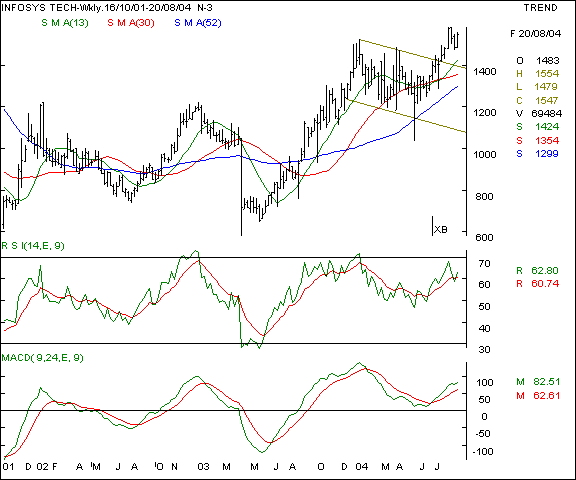
Infosys - This software bell weather has been advocated by us as a buy on declines in the recent past and has been out-performing the markets due to the defensive perception of this sector. The sector is relatively untouched by the oil worries and the TCS listing remains the only wildcard worry. Should there be any offloading by institutional players, it would be an entry opportunity for the long term players.
Your call of action -
-
Investors / cash segment players - Buy the counter on major declines to the 1490 levels and hold with a stop loss at the 1425 levels. Expect to book profits at the 1600 levels in the medium term.
-
Aggressive F&O traders - Buy the September futures above the 1564 levels and hold with a stop loss at the 1547 levels. Expect profit taking at the 1580 / 1585 levels in the near term. Should the markets be really firm, we expect the 1594 levels to be a possibility
-
Derivatives contract size - Market lot = 200 shares. F&O margin = approx Rs 52,000 (subject to change daily )
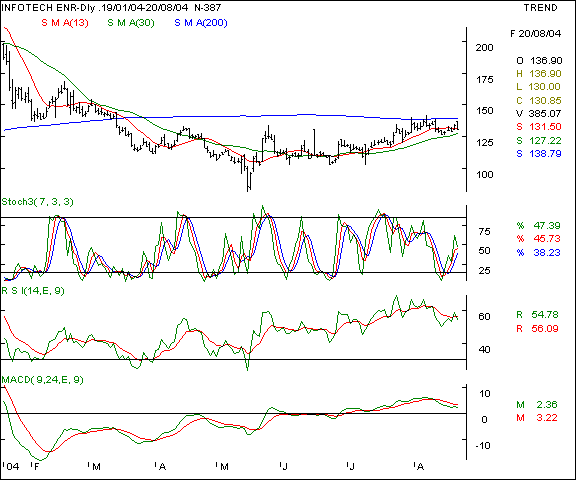
Infotech Enterprises - This software mid-cap story is a trading / speculative grade recommendation as the scrip attempts higher tops and a breakout above it's 200 DMA. The confirmation would be the breakout above the 140 levels and high volumes of over 3 lac shares per day on the NSE. The software sector is undergoing a buying phase and this stock is a likely beneficiary.
Your call of action -
-
Investors / cash segment players - Buy the scrip only above the 140 mark with a breakout on heavy volumes. Hold with a stop loss of 133.50 and expect a target of 152 - 154 in a conducive market in the near term
-
Aggressive F&O traders - N/a
-
Derivatives contract size - N/a
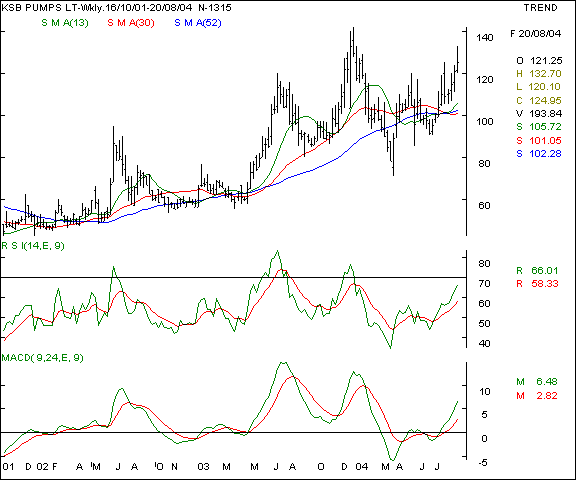
KSB Pumps - This company is manufacturing submersible pumps and will be a beneficiary of the agricultural thrust of this government. The recent emphasis on the monsoons has seen agri-related stocks coming in the limelight and this scrip with a MNC parentage is a good buy for the long term investor. The counter is making higher tops and bottoms and is likely to be a steady performer. We recommend a buy on declines.
Your call of action -
-
Investors / cash segment players - Buy on declines of 115 with a stop loss at the 95 levels. Expect 160 in a 6 month time frame in a conducive market
-
Aggressive F&O traders - F&O not available.
-
Derivatives contract size - F&O not available.
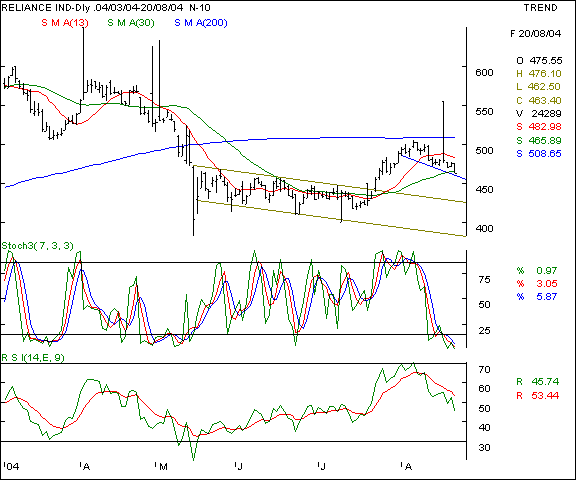
Reliance Industries - this petrochemicals major has been in the downward groove as the graphic shows. The scrip is making lower bottoms and tops and a fall below the 459 levels is likely to see further weakness in the counter. The short term momentum oscillators are pointing towards an oversold level and therefore a bounceback / relief rally maybe seen in the near term. However, the tone and tenor of the counter remains downwards. We recommend a sell / short sell for the near term.
Your call of action -
-
Investors / cash segment players - exit long positions on advances of 475 and above.
-
Aggressive F&O traders - Short sell the September futures below the 459 levels with a stop loss at the 463 mark. Expect to book profits at the 453 levels in the near term.
-
Derivatives contract size - Market lot = 600 shares. F&O margin = approx Rs 48,000 (subject to change daily )
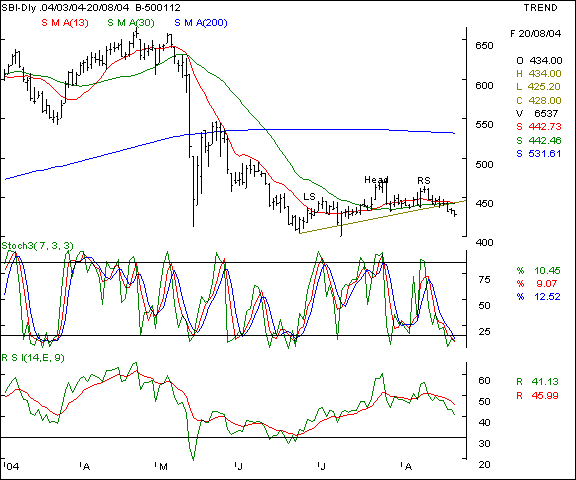
SBI - This PSU banking major is the largest holder of gilts and will suffer the biggest hit in a rising inflationary scenario as it's portfolio erodes. The higher exposure to the rural sector will be another negative factor for the counter. As we had accurately predicted a breakdown below the 436 levels ( a bearish head and shoulder pattern ) has been seen. We revise our downward target to the 420 levels in the coming week in a bearish market and advoccate a sell on advances.
Your call of action -
-
Investors / cash segment players - exit the counter on advances upto 440 and above
-
Aggressive F&O traders - Sell the September futures at the 433 levels with a stop loss at the 437 levels. We expect a profit taking level to be 420 - 422 in the near term.
-
Derivatives contract size - Market lot = 500 shares, F&O margins = approx Rs 38,000 ( subject to change daily )
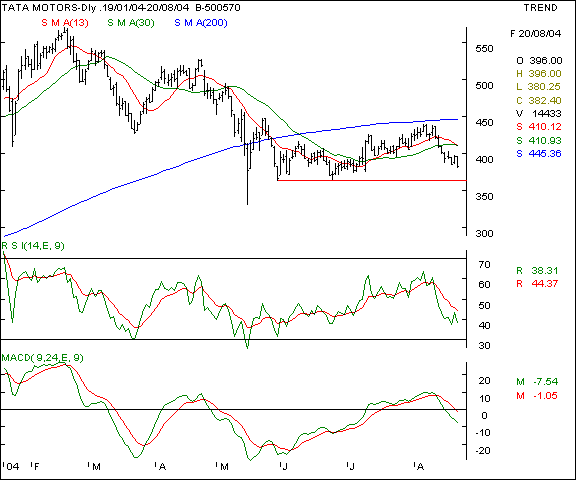
Tata Motors - this automobile major is in a bearish pattern as the scrip makes lower bottoms and tops formation. The biggest negatives fundamentally are the rising crude oil prices, rising international steel prices ( Posco recently raised prices ), higher interest rates expected and a slowdown in the economy due to the inflationary pressures. Much will depend on the oil prices and any adverse news on the crude front will see this counter taking a fresh beating. We recommend a short sell on triggers. In a weak market, we expect the 360 / 365 levels as a fair possibility.
Your call of action -
-
Investors / cash segment players - Exit on major advances to the 400 levels and stay away from fresh commitments till further notice.
-
Aggressive F&O traders - Should the oil prices rise and the scrip (spot) fall below the 378 levels, short the September futures with a stop loss at the 384 levels. Expect to book profits at the 372 and then the 368 levels in the near term in a weak market.
-
Derivatives contract size - Market lot = 825 shares, F&O margins = approx Rs 58,000 ( subject to change daily )
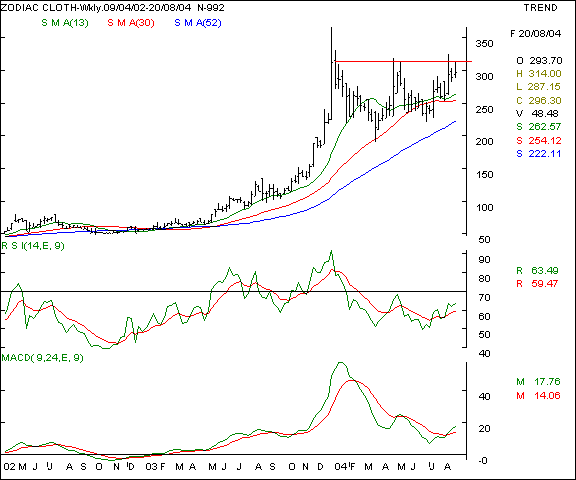
Zodiac Clothing - This branded textiles major is an exporter and established player in the European and US markets. Lower cotton prices due to a good crop will add to the bottomline as input costs fall. The chart pattern is showing a double top at the 316 levels which needs to be surpassed with heavy volumes and sustained closing above this level. The oscillators are showing a bullish trend and we recommend a buy on a breakout in a firm market.
Your call of action -
-
Investors / cash segment players - Buy the stock only when it trades sustainably above the 320 levels with higher volumes of atleast 8000 shares / day on the NSE. Expect to book profits at the 450 mark in a good market in a year. Hold with a stop loss at the 285 levels. Buy small quantities only as the scrip is not very liquid.
-
Aggressive F&O traders - F&O not available.
-
Derivatives contract size - F&O not available.
|
Indices - domestic |
BSE Sensex - This 30 share BSE index has been making lower tops and bottoms formation as the bulls pare positions at higher levels. The recent bottom made at the 5025 levels is likely to be a critical level to watch in the coming week. Should the BSE Sensex close below this level, we expect the 4965 levels as the next support.
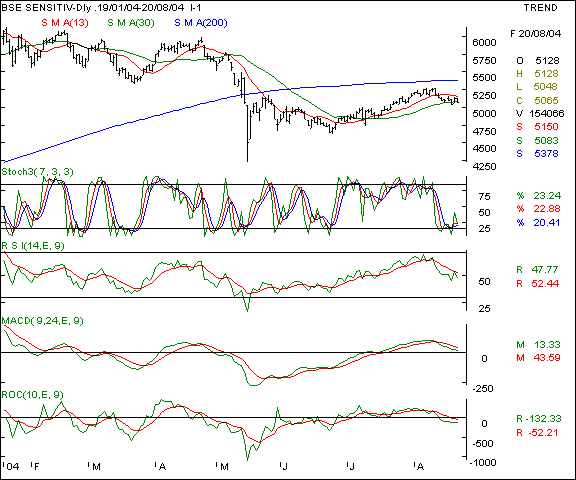
Your call of action - Since the Sensex futures are not very liquid, we suggest trading the Nifty 50 instead.
Nifty 50 - This NSE benchmark is showing signs of pressure as the 1577 levels will be the critical support in the coming days to watch. Should this level be violated downwards, a fall to the 1564 levels should be rapid. In case of a weaker market sentiment, even the 1558 can be seen. On the higher side, a closing over the 1608 levels will be an indicator of strength in the near term. The bias seems tilted towards the downsides as of now.
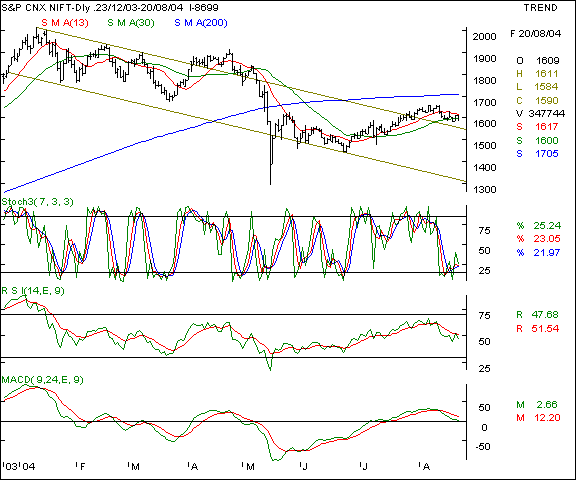
Your call of action - We advocate short selling the Nifty below the 1577 levels with a stop loss at the 1587 levels. Expect to book profits partially at the 1564 mark and square up completely at the 1558 levels. The downside will be determined by the volumes traded on the breakdown day.
|
Indices - international |
Dow Jones Industrial Average - The Dow has seen a spectacular 285 point jump in this week as the lower tops and bottoms formation continued unbroken. We expect the upsides to be capped at the 10230 and the index to succumb to profit taking. On the lower side, we expect support at the 9930 levels, below which 9820 levels will be seen.
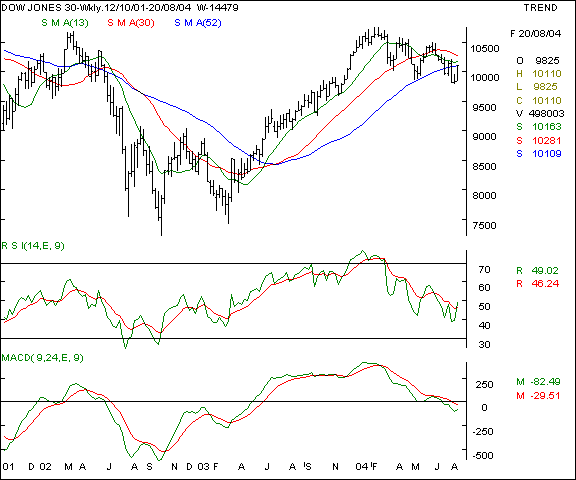
Your call of action - Since Indian investors are not allowed to trade in overseas markets, this is a pure academic study.
Nasdaq - this technology laden index is also undergoing a sharp pullback as the lower bottoms formation has seen a big plunge of over 300 points in 9 weeks. The upsides are unlikely to be above the 1910 levels and the downsides will be at the 1770 levels in the coming week
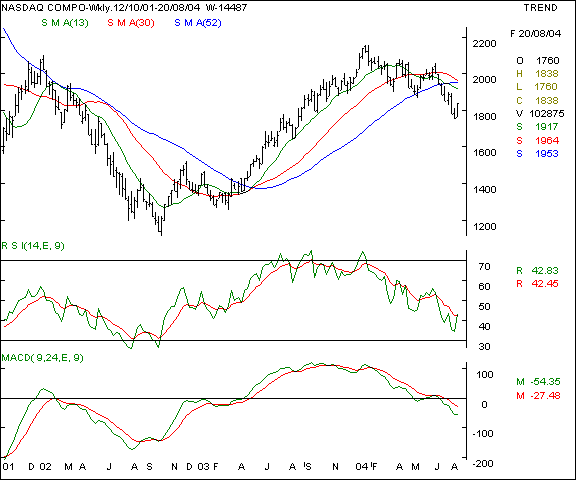
Your call of action - Since Indian investors are not allowed to trade in overseas markets, this is a pure academic study.
FTSE - This UK index has seen lower tops and bottoms formation and will see critical support at the 4260 levels as the index shows signs of weakness. A pullback maybe seen to the 4440 levels in the coming week, however, it is likely to be temporary in nature.
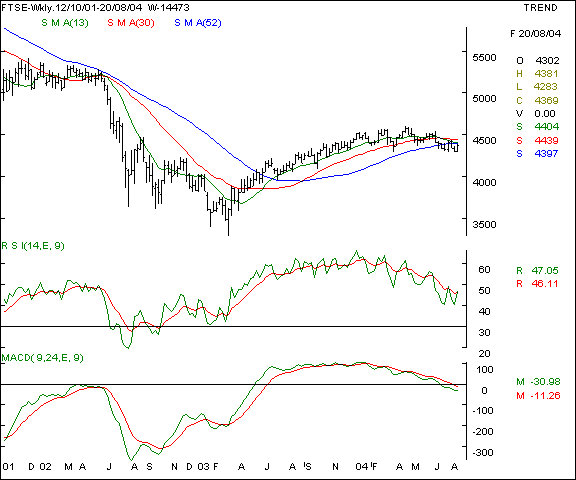
Your call of action - Since Indian investors are not allowed to trade in overseas markets, this is a pure academic study.
|
Trading tips for the week |
-
The put / call ratio is climbing and is currently at the 0.32 : 1 levels and the outstanding positions in the derivatives segment have shown a marginal rise. The FII investments are continuing to be negative.
-
There is offloading at higher levels in stock futures. That indicates a cautious approach as long positions in individual stocks is being hedged by Nifty shorts.
-
The current week is crucial for the markets as derivatives expiry of the August series coincides with the listing of TCS shares.
-
The index heavy-weights are showing weakness again. This in turn will drag the indices and cause a fall.
-
Trades must be executed in small volumes due to the higher volatility expected. Trade fewer counters and conserve cash for future opportunities.
-
Standby for fresh recommendations via SMS on a real - time basis.
- Have a profitable week.
- Vijay L Bhambwani
- Ceo :- Bsplindia.com
The author is a Mumbai based investment consultant and invites feedback at Vijay@BSPLindia.com and ( 022 ) 23438482 / 23400345.
SEBI disclosure :- The author has no positions in any securities mentioned above.
- While all due care has been taken while in compiling the data enclosed herein, we cannot be held responsible for errors, if any, creeping in. Please consult an independent qualified investment advisor before taking investment decisions. This mail is not sent unsolicited, and only advisory in nature. We have accepted no consideration from any company mentioned above and recommend taking decisions on merits of the stocks from our viewpoint. This email is being sent to you as a paid subscriber. Please protect your interests and ours by not disclosing the contents to any un-authorised person/s
Legal notice :- The Professional Ticker Reader is a trademark of Bhambwani Securities (P) Ltd. and any un-authorised replication / duplication in part or full will be infringing our trademark and will result in legal action being enforced on the infringing persons / parties.