- The Professional Ticker Reader TM
- Your accurate, authentic and affordable guide to investing
Flavours of the week July 18, 2004
These are stocks that we expect to out-perform the markets. Cash and derivative strategies are advised thereon. Please stay online to enable loading of graphics from our servers. Please also read the trading tips section at the end of the newsletter.
|
Individual stocks. |
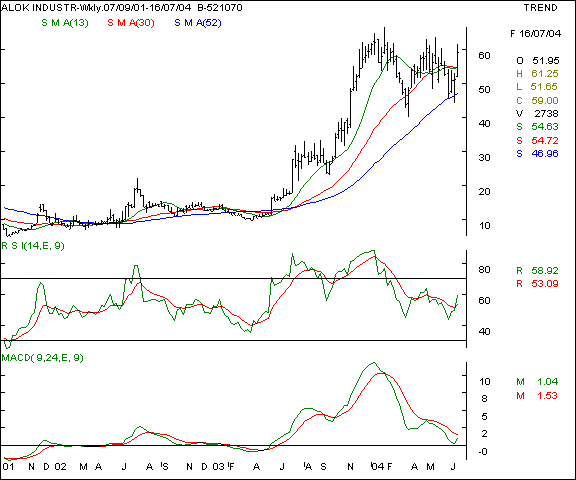
Alok Textiles - this mid cap textile stock has been in an uptrend and the recent sops to the sector is likely to keep the scrip in the limelight. The stock is nearing the congestion levels at the 65 mark which needs to be surpassed with high volumes to signal a breakout. We recommend a speculative buy on the counter in small lots. This being a mid-cap story, volatility and risk will be high.
Your call of action -
-
Investors / cash segment players - Buy the scrip in small lots on declines and average down to 54 levels where immediate support exists. Maintain a stop loss at the 49 levels and a target of 65 in the near futures, where atleast 50 % of holdings should be liquidated. Once a convincing breakout occurs with high volumes, expect a further upmove to the 70 levels in a conducive market.
-
Aggressive F&O traders - derivatives n/a
-
Derivatives contract size - n/a.
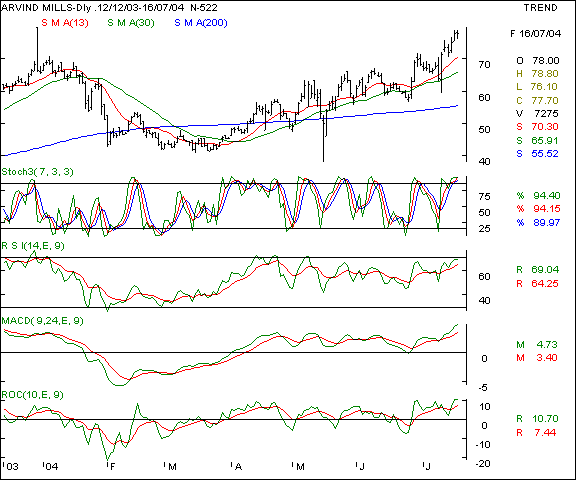
Arvind Mills - This scrip was recommended as a buy last week above a breakout of the 73 levels and has fulfilled our bullish expectations. Being a textile story and budget beneficiary, we expect the upmove to continue over a medium term perspective. The oscillators are signalling a strength in the undertone and the short term momentum oscillators show a slight declines as fairly possible. We recommend a buy on declines for the discerning investor.
Your call of action -
-
Investors / cash segment players - delivery based buyers are advocated to buy on declines upto 72 - 73 levels and maintain a stop loss at the 69 levels. Expect to book profits at the 83 - 85 levels in the medium term.
-
Aggressive F&O traders - traders can buy the July futures at 75 levels and maintain a stop loss at the 73 levels. Expect to book profits in a bullish market at the 80 / 82 levels in the near term.
-
Derivatives contract size - Market lot = 4300 shares, F&O margins = approx Rs 2,35,000 ( subject to change daily ).
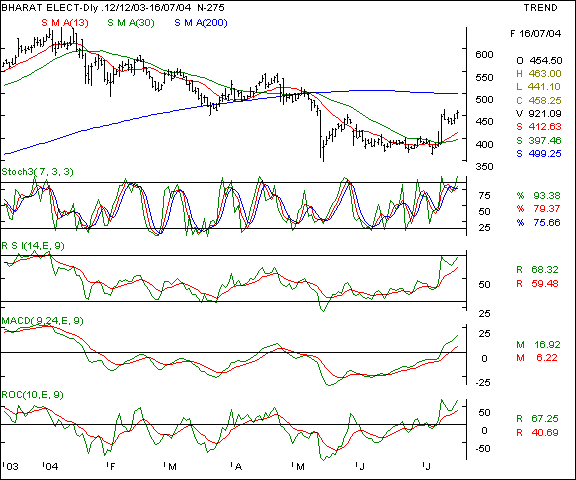
Bharat Electronics - This PSU electronics major is showing signs of recovery after the budget as the defence outlay has been stepped up. The scrip is likely to face resistance at the 468 levels, above which a further upmove to test the 200 day SMA is likely. The oscillators are signalling a strength and upsides to the a 490 levels can be expected in a bullish market.
Your call of action -
-
Investors / cash segment players - Buy the counter on declines to the 450 - 455 levels in small lots and average downwards to the 435 levels. Maintain a protective stop loss at the 425 levels. Expect to book profits at the 480 - 490 levels in a strong market in the medium term.
-
Aggressive F&O traders - Buy the July futures contracts at the 456 levels and hold with a stop loss at the 450 mark. Expect to book profits at the 465 levels in the near term.
-
Derivatives contract size - Market lot = 550 shares, F&O margins = approx Rs 62,000 ( subject to change daily ).
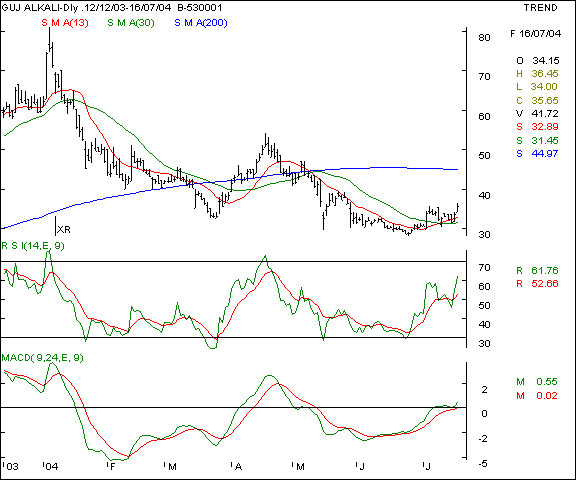
Gujurat Alkali - this soda ash / caustic soda manufacturer is showing signs of revival again after a long hiatus as the chart pattern indicates. The daily traded volumes have jumped up 5 times in the recent past. That makes the upmove more credible. The oscillators are pointing to a further upmove and should the scrip remain above the 38 mark consistently, expect the upmove to sustain and test the 45 mark in the near term. We recommend a buy on the counter.
Your call of action -
-
Investors / cash segment players - buy the counter at current levels and hold with a stop-loss at the 30 levels. Expect to book partial profits at the 40 levels and absolute profits at the 43 / 44 levels in a firm market.
-
Aggressive F&O traders - N/a
-
Derivatives contract size - N/a.
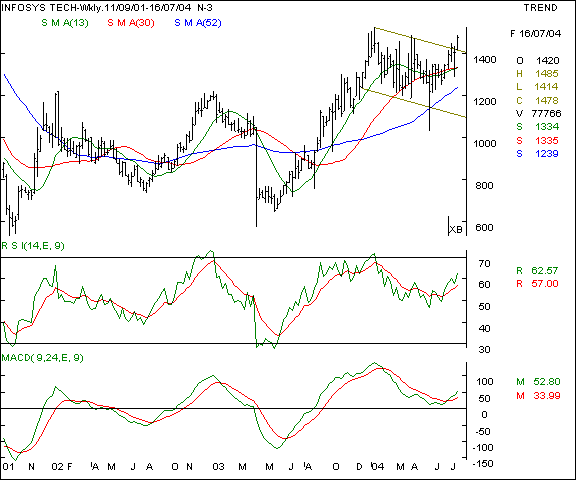
Infosys - this scrip was recommended in the previous edition at the breakout above the 1445 levels and has performed as per our expectations. The only negative for the sector is the TCS ipo which can see some offloading on the frontline technology stocks. The momentum oscillators are pointing to a bullishness in the undertone and as long as the counter stays above the 1370 mark, the bullishness will remain intact. We recommend a hold / buy on declines on the counter.
Your call of action -
-
Investors / cash segment players - we recommend fresh buying only on declines at the 1425 levels in small lots and average down to the 1375 levels. Maintain a stop loss at the 1360 levels and expect to book profits at the 1500 levels in the short term. Over a medium to longer term, expect the 1550 levels in a bullish market.
-
Aggressive F&O traders - Buy the July futures at the 1460 levels and hold with a stop loss at the 1430 levels. Expect to take profits at the 1500 levels.
-
Derivatives contract size - Market lot = 200 shares. F&O margin = approx Rs 48,000 (subject to change daily )
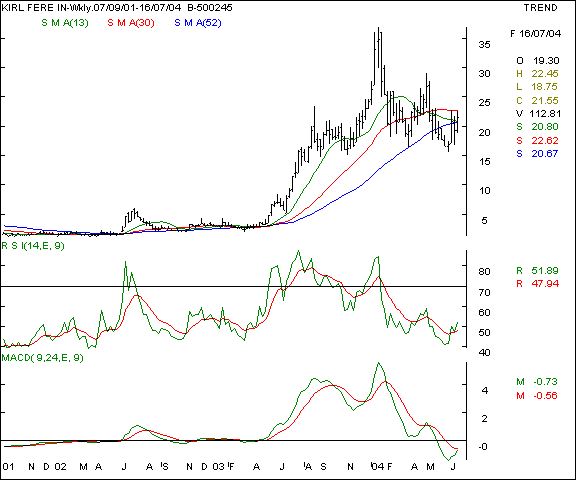
Kirloskar Ferrous - this is a turnaround story and in the metals sector which is in a bullish grip. The stock gets resistance at the 23 levels which need to be surpassed and closing above this levels is necessary on a continous basis. As long as the counter remains above the 17.50 levels, the uptrend is still valid. We recommend a buy for the medium / long term investor.
Your call of action -
-
Investors / cash segment players - buy the counter if the markets are bullish especially if the scrip trades above the 23.50 mark consistently. Hold with a stop loss at 18 and expect to book profits at the 27 mark atleast partially and at 32 levels completely in the medium term. Invest in small lots only.
-
Aggressive F&O traders - N/a
-
Derivatives contract size - N/a
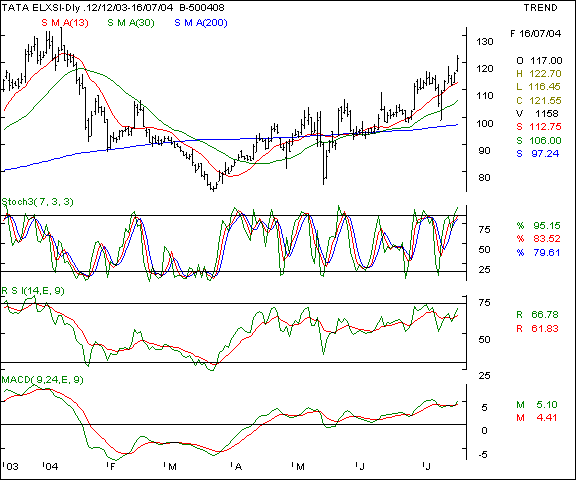
Tata Elxsi - this tata group technology player is showing a bullish formation on the charts as the formation is that of higher tops and bottoms. The counter is a beneficiary of the sentiments as the segment is seeing defensive buying as well as the TCS factor. The company is likely to reap windfall returns as the TCS holdings are likely to be converted to cash. We recommend a trading buy in the counter.
Your call of action -
-
Investors / cash segment players - buy the counter at the 120 levels in small lots and hold with a stop loss at the 114 levels. Expect to book profits at the 128 levels partially and take complete profits at the 132 levels in a good market.
-
Aggressive F&O traders - Derivatives n/a
-
Derivatives contract size - N/a
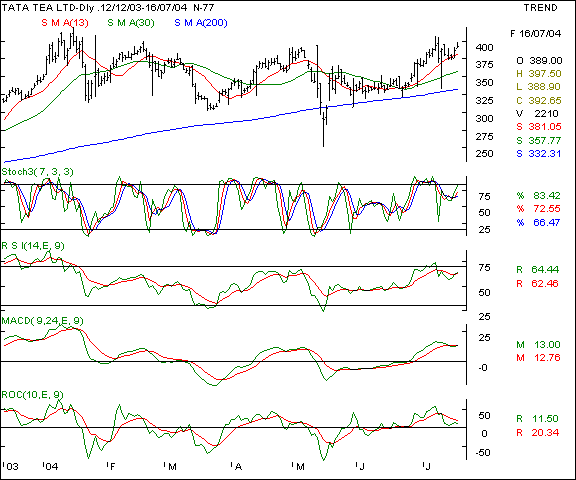
Tata Tea - This tata group FMCG player is showing a strong chart formation as the scrip is making an ascending pattern, with the 200 day SMA as a strong support base. The counter is likely to face resistance at the 405 levels which is the congestion zone and triple top in the daily charts. The company is cash surplus and a force to reckon with in the business. There momentum is upwards and buying is recommended on declines or a sharp breakout above the 405 levels. The monsoon news is the only negative for the scrip which is not yet clear as the met department is likely to announce the update on the rains.
Your call of action -
-
Investors / cash segment players - buy the scrip in small lots at the 385 levels and hold with a stop loss at the 373 mark. Expect to take profits at the 403 levels atleast partially. In a conducive market, higher levels are possible in the medium term.
-
Aggressive F&O traders - Buy the July futures above the 402 mark with a stop loss at the 398 levels. Expect to book profits at the 404 levels in the near term.
-
Derivatives contract size - Market lot = 550 shares, F&O margins = approx Rs ( subject to change daily ).
|
Indices - domestic |
BSE Sensex - the sensex is making a rounding bottoms, saucer like formation in the downward sloping channel. That signals a short term rally in the markets. The oscillators are also pointing towards a similar scenario, however, a confirmatory upmove is required to signal a conclusive buy. We feel that the upsides are likely to be capped at the 5120 levels in the coming week. On the lower side, watch the 4840 levels for support in the short term future.
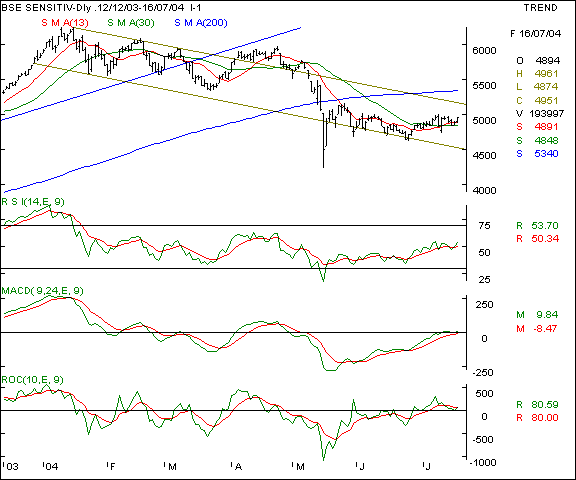
Your call of action - Since the Sensex futures are not very liquid, we suggest trading the Nifty 50 instead.
Nifty 50 - the Nifty is making similar chart patterns to the sensex and the index gets support at the short term moving averages at the 1518 levels. On the higher side, expect resistance at the 1587 levels, beyond which the 1610 levels are possible. The momentum oscillators are pointing towards a short term upmove on the Nifty in the near term.
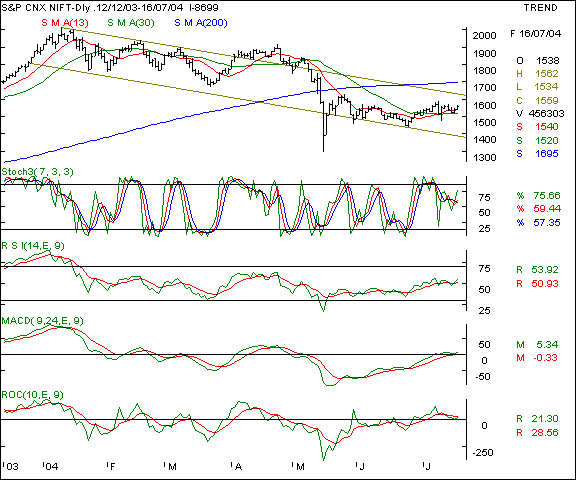
Your call of action - We advocate fresh trades on the Nifty on the long side only above the 1567 mark in small quantities with a stop loss at the 1554 levels. On the higher side, expect to book profits at the 1583 levels.
|
Indices - international |
Dow Jones Industrial Average - This old economy benchmark index is showing signs of fatigue at higher levels. The index is likely to see resistance on the upsides at the 10,370 levels and support at the 10,020 levels. We expect selling at rallies due to the earnings worries in the short term. The oscillators are pointing towards a weakness in the undertone.
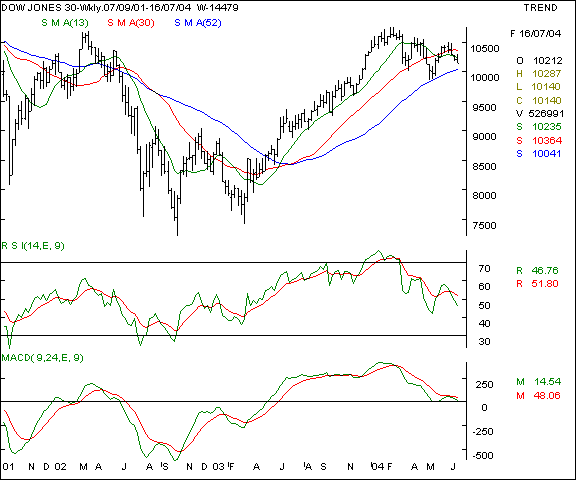
Your call of action - Since Indian investors are not allowed to trade in overseas markets, this is a pure academic study.
Nasdaq - this new economy benchmark is showing higher degree of weakness as compared to the Dow Jones and has broken below the 52 week average. The oscillators are in a sell mode and the index is likely to test the 1823 levels in the near / medium term as the upsides are limited and vulnerable to offloading by bulls. On the higher side, we expect the 1970 levels to be a strong resistance in the near term.
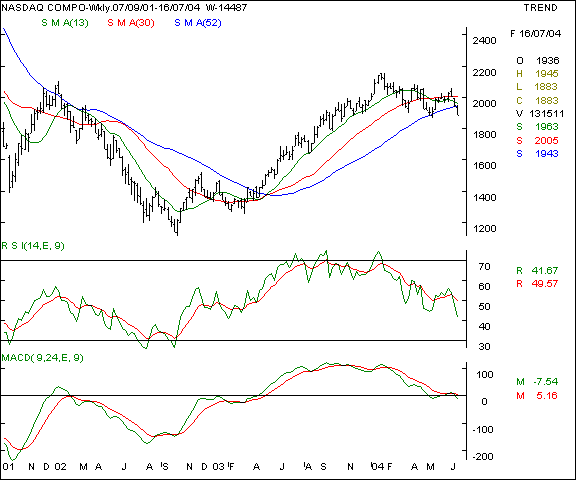
Your call of action - Since Indian investors are not allowed to trade in overseas markets, this is a pure academic study.
FTSE - this UK index is in a downward spiral as the 52 week SMA support has been violated and the oscillators are pointing towards a further fall. Any closing below the 4300 levels is likely to see an accelerated fall in the short term. We expect a downside of 100 points this weak if the sentiments are weak.
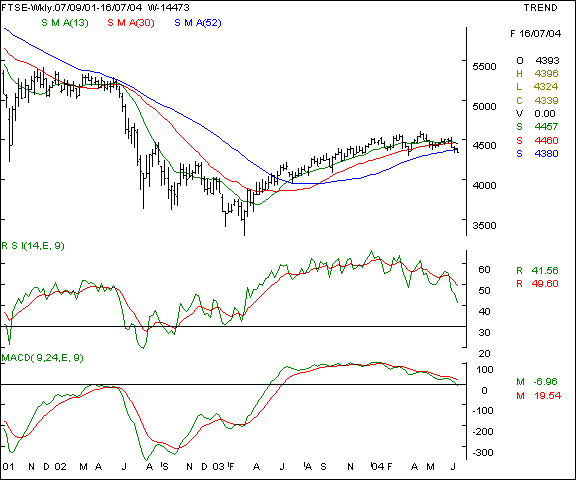
Your call of action - Since Indian investors are not allowed to trade in overseas markets, this is a pure academic study.
|
Trading tips for the week |
-
The put / call ratio is climbing and is currently at the 0.52 : 1 levels and the outstanding positions in the derivatives segment have shown a marginal increase. The FII investments are continuing to be negative.
-
There is offloading at higher levels in stock futures. That indicates a cautious approach as long positions in individual stocks is being hedged by Nifty shorts.
-
The current month is crucial for the markets as there are big IPO announcement's and therefore we expect a shift of focus & resources to the primary markets. The monsoons are likely to be a make or break factor for the markets.
-
The index heavy-weights are showing strength again. This in turn will boost the indices and cause a feel good factor. The only worry is that this upbeat sentiment should continue.
-
Trades must be executed in small volumes due to the higher volatility expected. Trade fewer counters and conserve cash for future opportunities.
-
Standby for fresh recommendations via SMS on a real - time basis.
- Have a profitable week.
- Vijay L Bhambwani
- Ceo :- Bsplindia.com
The author is a Mumbai based investment consultant and invites feedback at Vijay@BSPLindia.com and ( 022 ) 23438482 / 23400345.
SEBI disclosure :- The author has no positions in any securities mentioned above.
- While all due care has been taken while in compiling the data enclosed herein, we cannot be held responsible for errors, if any, creeping in. Please consult an independent qualified investment advisor before taking investment decisions. This mail is not sent unsolicited, and only advisory in nature. We have accepted no consideration from any company mentioned above and recommend taking decisions on merits of the stocks from our viewpoint. This email is being sent to you as a paid subscriber. Please protect your interests and ours by not disclosing the contents to any un-authorised person/s
Legal notice :- The Professional Ticker Reader is a trademark of Bhambwani Securities (P) Ltd. and any un-authorised replication / duplication in part or full will be infringing our trademark and will result in legal action being enforced on the infringing persons / parties.