- The Professional Ticker Reader TM
- Your accurate, authentic and affordable guide to investing
Flavours of the week March 06, 2004
These are stocks that we expect to out-perform the markets. Cash and derivative strategies are advised thereon. Please stay online to enable loading of graphics from our servers. Please also read the trading tips section at the end of the newsletter.
|
Individual stocks. |
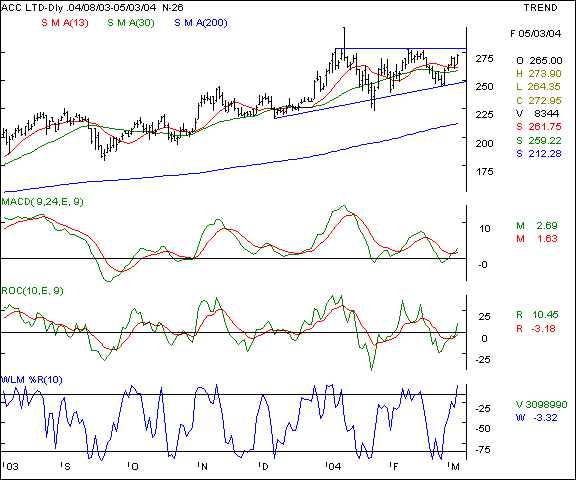
ACC - This cement major is showing signs of consolidation with an upward bias. The most noticeable aspect is the bullish wedge formation which is likely to see an upward breakout above a closing of 279 levels. The same must be accompanied by higher volumes and a firm overall market, which will raise the probability of success. The oscillators are pointing towards a minor fall before the breakout occurs and traders must buy only after the confirmatory signal is received.
Your call of action -
-
Investors / cash segment players - Buy the counter above the 279 mark and maintain a stop loss at the 271 mark. Expect a price of 294 in a few weeks in a conducive market. Longer term investors may expect a higher level over a 6 month period.
-
Aggressive F&O traders - Buy the March futures above a closing of 280 and maintain a protective stop loss at the 275 levels. Expect to book profits at the 286 - 288 in the near term in a firm market.
-
Fixed return strategy - initiate naked sales by selling the March 240 puts at a suggested premium of Rs. 2 and await expiry. The return on investment ( margin paid ) is approximately 4.5 % per month.
-
Derivatives contract size - Market lot = 1500 shares. F&O margins approx = Rs 86,000 ( subject to change daily ).
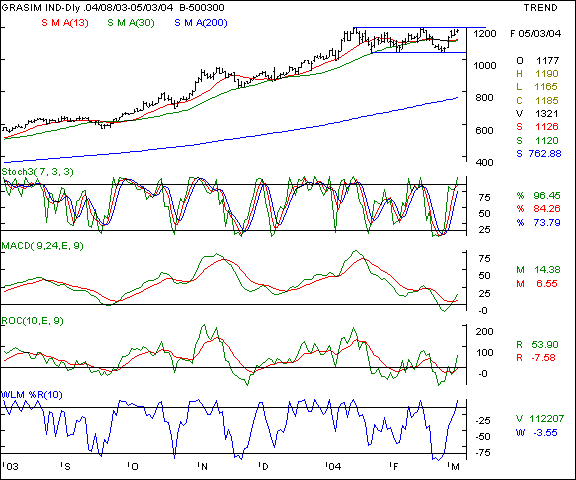
Grasim - this cement major is showing classic text book style consolidation between the 1050 and 1200 levels. The chart below shows a short term channel at the specified levels and a triple top formation at the 1200 levels. A breakout above the 1205 levels and a closing above this level with high volumes will be a signal for the bulls to go long again. The momentum oscillators are showing a revival in sentiments and a confirmatory rally above the upper trend-line will be a trigger for buying.
Your call of action -
-
Investors / cash segment players - Buy the counter above the 1205 mark and maintain a stop loss at the 1160 mark. Expect a price of 1270 - 1280 in a few sessions in a conducive market. Longer term investors may expect a higher level over a 3 month period.
-
Aggressive F&O traders - Buy the March futures above a conclusive close of 1210 ( quoting at a Rs 4 premium to cash ) and maintain a tight stop loss at the 1175 levels. Expect to book profits at the 1250 - 1260 in the near term. Options players may buy the March 1200 calls at a maximum premium of Rs. 18
-
Fixed return strategy - Options are not liquid on this counter.
-
Derivatives contract size - Market lot = 700 shares. F&O margins approx Rs 1,47,000 ( subject to change daily ).
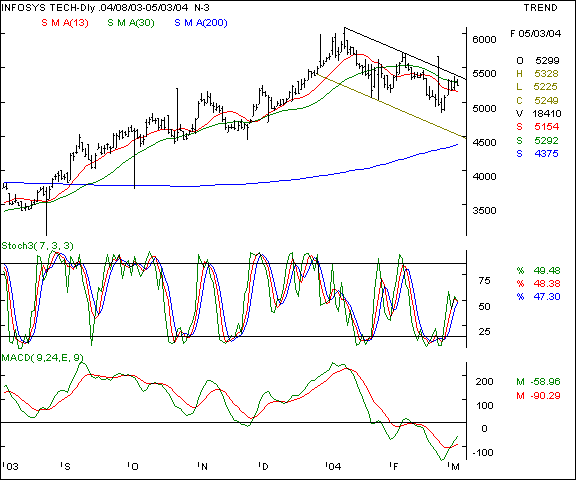
Infosys - This counter is in a downward spiral and is moving within a downward sloping channel. The resistance is likely to be seen at the 5365 levels which is the upper trendline. The sectoral outlook is weak due to the election rhetoric regarding BPO out-sourcing issues. The only silver lining is the rising US $ which is going up on bear covering in the forex markets. The scrip is making lower tops and bottoms and should it be unsuccessful in giving a breakout above the channel, expect the counter to see support at the 5150 levels and then possibly slide lower to 4950 levels. vide our editions dtd 08/11/03, 13/12/03, 20/12/03, 27/12/03, 03/1/04 & 07/02/04 Click here to view previous editions.
Your call of action -
-
Investors / cash segment players - Delivery based selling is advocated above the 5400 mark.
-
Aggressive F&O traders - Short sell the March futures at the 5300 mark and maintain a stop loss at the 5370 levels. We expect the scrip to dive upto the 5100 levels in a weak market.
-
Fixed income strategy - sell the March 5600 calls at a suggested premium of Rs 65. On an initial margin payment, the rate of return is approximately 7 % per month.
-
Derivatives contract size - Market lot = 100 shares, F&O margins = approx Rs 1,25,000 ( subject to change daily ).
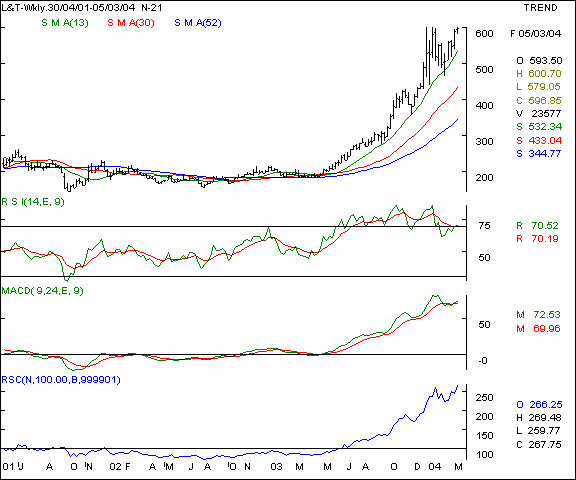
Larsen & Toubro - This engineering giant is in a bull grip as the long term trend is extremely bullish and the scrip itself is a market out-performer. The recent announcement of setting aside Rs 500 crs for acquisitions is likely to be a bullish trigger for the counter. The scrip is on the verge of a breakout of the congestion zone at the 600 - 605 levels. A convincing and sustainable close above this band with higher volumes will signal the beginning of a new upmove on this counter. We advocate a buy on the counter.
Your call of action -
-
Investors / cash segment players - Buy the counter at the 600 mark and maintain a stop loss at the 550 mark. Expect a price of 675 - 685 in a quarter in a conducive market. Longer term investors may expect higher levels of over 725 over a 6 month period.
-
Aggressive F&O traders - Buy the March futures above a breakout of Rs 605 and maintain a stop loss at the 585 levels. Expect to book profits at the 635 in the coming fortnight. Exposure should be curtailed to protect your capital float.
-
Fixed income strategy - Sell the 530 March puts at a suggested premium of Rs 3. On the initial margin paid, the rate of return works out to Rs 3 % per month.
-
Derivatives contract size - Market lot = 1000 shares. F&O margins = approx Rs 1,50,000 ( margins subject to change daily )
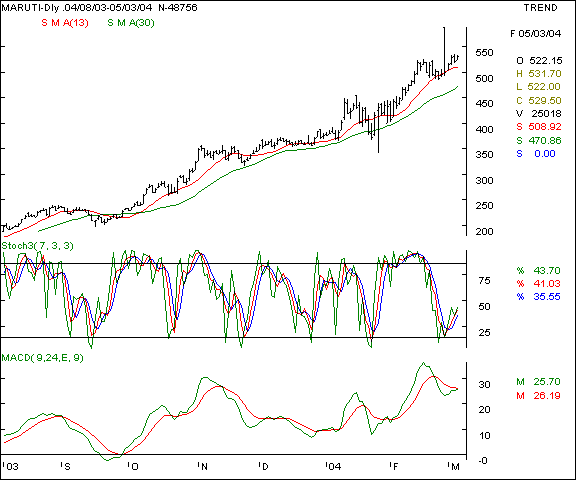
Maruti - this scrip has been one of the more prolific recommendations and also one of the more profitable ones. The reco dates were 08/11/03, 03/01/04, 24/01/04 and 31/01/04 Click here to view previous editions. The scrip is a strong market out-performer and is in a major uptrend as the chart below indicates. We recommend a buy on declines.
Your call of action -
-
Investors / cash segment players - Buy the counter at the 525 mark and maintain a stop loss at the 505 mark. Expect a price of 545 - 555 in the short term in a conducive market. Longer term investors may expect a higher level over a 6 month period.
-
Aggressive F&O traders - Buy the March futures at the 530 mark and hold with a stop loss of 518 levels. Expect to book profits at the 545 - 550 in a firm market in the short term itself. Our 2 - 3 week target for this counter is Rs 560.
-
Fixed income strategy - Sell the March 480 puts at a suggested premium of Rs 5 and wait till expiry.
-
Derivatives contract size - Market lot = 1,600 shares, F&O margins = approx Rs 2,70,000 ( subject to change daily ).
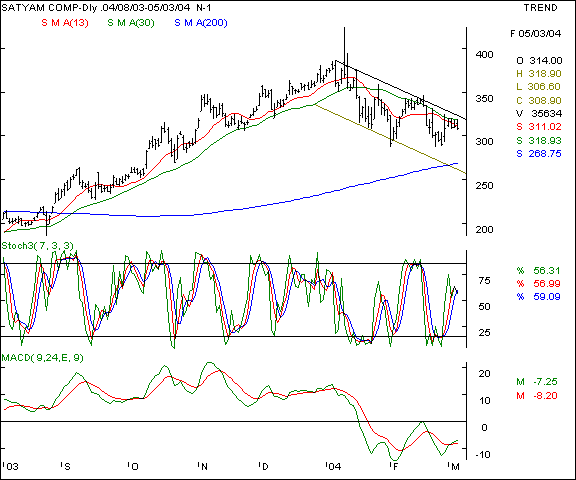
Satyam Computers - This stock is mirroring the chart pattern of Infosys as depicted above. An identical downward sloping channel is seen and resistance at higher levels will be seen at the 322 - 324 levels. Should the scrip be unable to surpass these levels even in a firm market, expect a slide below the 300 mark in the next down phase. The oscillators are showing a weakness in the undertone for this stock and the fall is likely to get accelerated below the 305 mark. We recommend a sell / short sell on the counter.
Your call of action -
-
Investors / cash segment players - Sell the counter at the 315 - 320 mark. Expect a price of 290 - 300 in a few weeks in a conducive market where you may buy back your stock. Protect yourself with a stop loss at the 328 mark.
-
Aggressive F&O traders - short the March futures on advances of 312 - 314 levels and maintain a stop loss at the 319 levels. The first profit taking point will be the 304 levels and thereafter, the 295 levels where shorts maybe squared up completely. Options players may buy the March 290 puts in minimum lots at a suggested premium of Rs 6.
-
Fixed income strategy - We suggest a short straddle strategy wherein traders may sell the March 270 puts and 360 calls at suggested premia of Rs 3 and Rs 2.50 respectively.
-
Derivatives contract size - Market lot = 1200 shares. F&O margins = approx Rs 83,000 ( margins subject to change daily ).
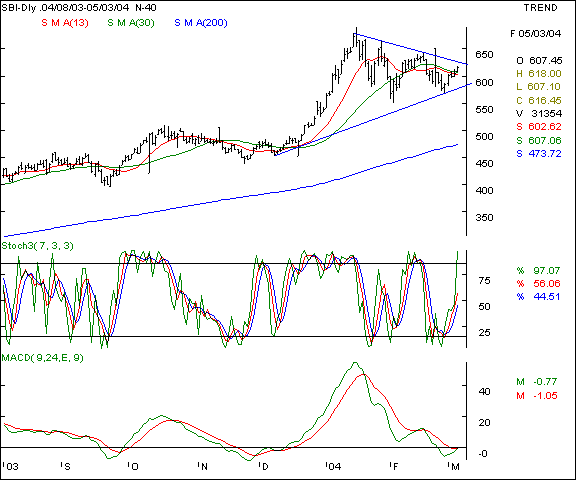
SBI - this PSU banking major figures # 2 on the top 5 outstanding exposure list in the F&O segment. The chart is showing a higher bottoms formation which is a classic bull formation. Should the upper trendline of the bullish wedge be surpassed, expect the upmove gain momentum. We recommend a buy on advances which will confirm the bullish breakout.
Your call of action -
-
Investors / cash segment players - Buy the counter at the present levels and leave some room for averaging downwards till the 600 levels. Maintain a stop loss at the 590 mark. Expect a price of 660 - 665 in a month in a conducive market. Longer term investors may expect a higher level over a 6 month period.
-
Aggressive F&O traders - Await breakout above the trigger price.
-
Fixed income strategy - sell the March 550 puts at a suggested premium of Rs 3. The returns on margins deployed amount to approx 3.5 % per month.
-
Derivatives contract size - Market lot = 1,000 shares. F&O margins = approx Rs 1,20,000 ( margins subject to change daily )
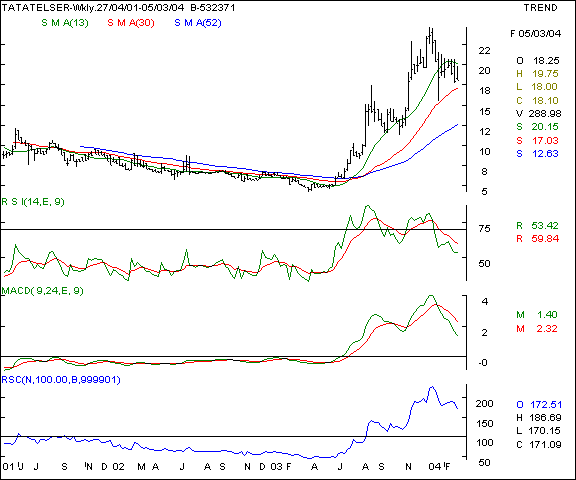
Tata Teleservices - This telecom service provider is now a market out-performer as the relative strength comparative is now higher than the BSE Sensex. The stock is coming off it's recent highs and retracing towards it's intermediate support levels. We recommend a buy on declines for the discerning delivery based patient investors with a 6 - 12 month time frame.
Your call of action -
-
Investors / cash segment players - Buy the counter at the 16 - 17 mark and maintain a stop loss at the 14 mark. Expect a price of 25 - 28 in a quarter in a conducive market. Longer term investors may expect a higher levels of 32 - 34 over a 6 - 8 month period.
-
Aggressive F&O traders - F&O n/a
-
Derivatives contract size - F&O n/a
Tisco - This steel major is in a long term uptrend and as the chart indicates, the counter has been consolidating in a bullish wedge since December 2003. The higher bottoms formation is inspiring confidence, though a confirmatory breakout above the 450 mark would be an effective go ahead on buying the stock. The momentum oscillators point towards a strength in the undertone.
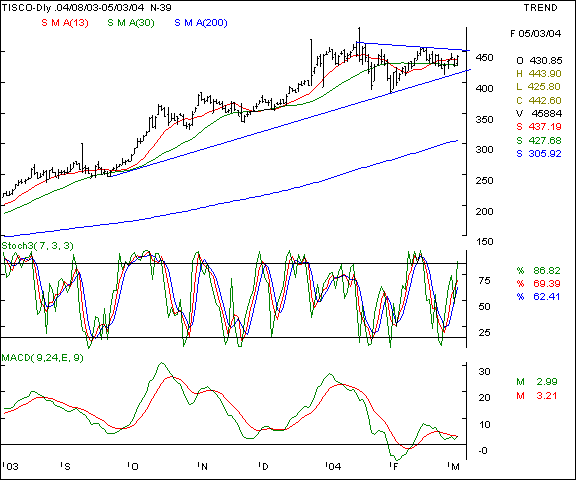
Your call of action -
-
Investors / cash segment players - Buy the counter at the current levels and leave room for averaging upto the 430 mark. Maintain a stop loss at the 422 mark. Expect a price of 465 - 475 in a month in a conducive market. Longer term investors may expect a higher level of 500 + over a 6 month period.
-
Aggressive F&O traders - Buy the March futures above the 451 mark and maintain a stop loss at the 446 levels. Expect to book profits at the 456 - 458 levels in the near term. At these levels, book partial profits and expect to liquidate the long positions at the 462 levels. Options players may buy the March 460 calls at a suggested premium of Rs 7
-
Fixed income strategy - sell the March 400 puts at a suggested premium of Rs 4. On the margins paid, the rate of return works out to 4.5 % per month.
-
Derivatives contract size - Market lot = 1800 shares. F&O margins = Rs 1,65,000 approx ( Margins subject to change daily )
|
Indices - domestic |
BSE Sensex - The index has maintained the trend-line support which is currently poised at the 5700. We do not foresee this level being violated this week. If the Sensex crosses the 5920 levels with high volumes and positive market breadth, we expect the 6020 levels to be a reality in the coming days. On the higher side, expect resistance at the 6,065 mark.
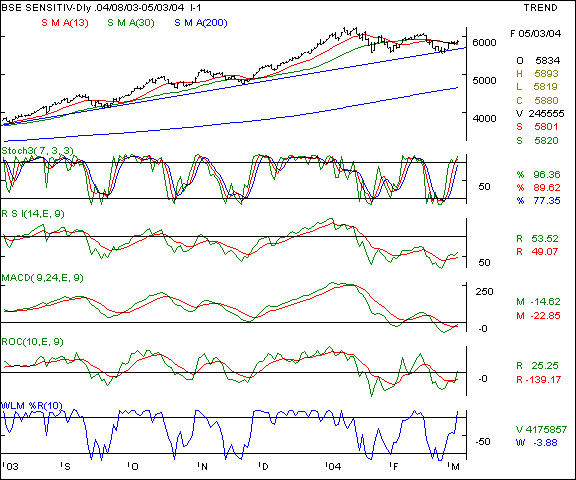
Your call of action - Since the Sensex futures are not very liquid, we suggest trading the Nifty 50 instead.
Nifty 50 - the Nifty is expected to rally upto the 1915 - 1932 levels if it continues to trade above the 1872 consistently with higher volumes and positive market breadth. Short term support was to be seen at the 1847 levels. The index has closed at the threshold levels and the oscillators are pointing towards a further upward momentum if the confirmatory upmove is seen. We feel the Nifty is a buy on advances in small lots.
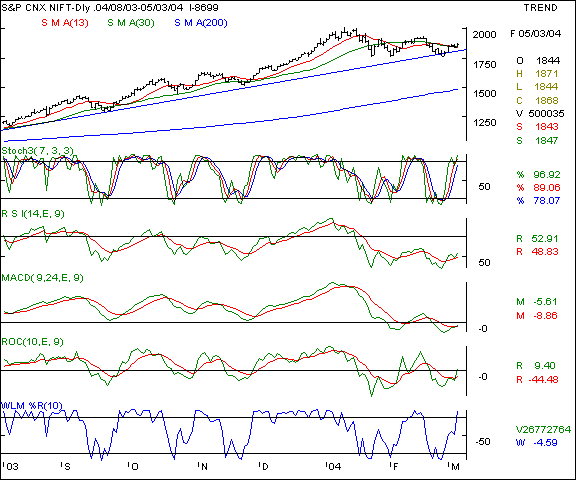
Your call of action - We advocate fresh trades on the Nifty on the long side only on advances that too in small lots. Buy the March futures above the 1875 levels and maintain a stop loss at the 1860 levels. Expect the first target to be at the 1897 and then the 1915 levels in the near term. Options players can sell the March 1780 puts at a suggested premium of Rs 14.
|
Indices - international |
Dow Jones Industrial Average - This old economy benchmark index measures the outlook on the New York stock exchange. Last fortnight we had advocated resistance at the 10,750 levels ( click here to view our previous editions ) which proved a major hurdle for the markets. The Dow Jones index is consolidating currently and is likely to take support at the 10400 in the immediate future. The index is likely to remain under pressure till it surpasses the 10750 levels with heavy volumes.
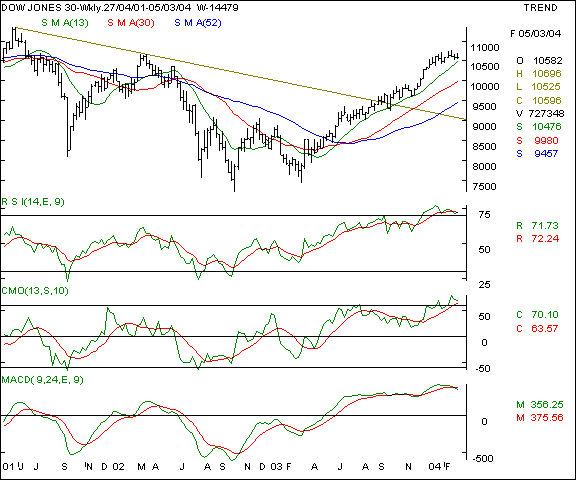
Your call of action - Since Indian investors are not allowed to trade in overseas markets, this is a pure academic study.
Nasdaq - This new economy benchmark index measures the outlook on the Nasdaq exchange. Last fortnight, we forecast that the 2000 levels will be a short term support and the index took support at the 2020 mark ( click here to view our previous editions ). The 1980 levels would remain a good base for this index - which if violated, will take the Nasdaq to 1950 levels. Only above a 2175 close, expect the next resistance at the 2240 - 2250 levels.
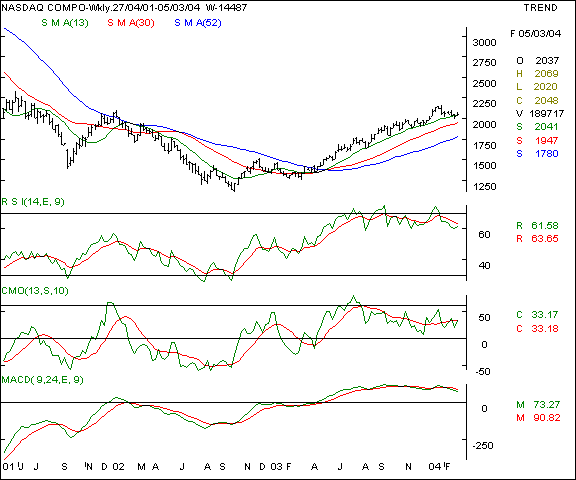
Your call of action - Since Indian investors are not allowed to trade in overseas markets, this is a pure academic study.
FTSE - This index measures the outlook on the London stock exchange. As we have been forecasting a 4560 level resistance, this index is making attempts to surpass those levels. ( click here to view our previous editions ). Our outlook though mildly positive for this index is also that of an under-performer as compared to the US markets. The oscillators are pointing towards a sideways market with a bullish bias at present levels - only above a conclusive close above 4580 levels, will a new rally start.
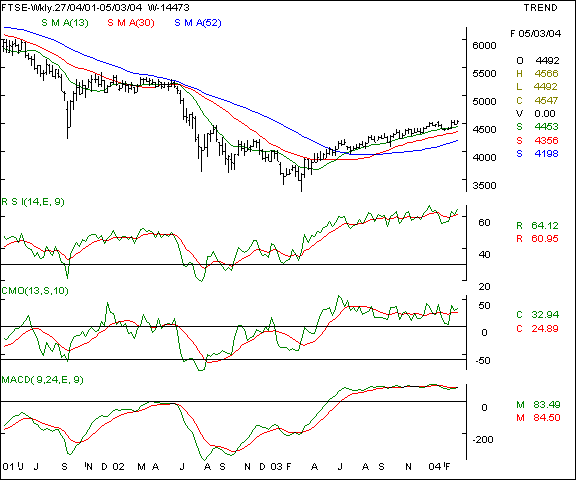
Your call of action - Since Indian investors are not allowed to trade in overseas markets, this is a pure academic study.
|
Trading tips for the week |
-
The put / call ratio is climbing and is currently at the 0.30 : 1 levels and the outstanding positions in the derivatives segment have shown a qualitative appreciation. The FII investments are continuing steadily. The outlook has improved significantly over the previous week.
-
The positive response to the ONGC issue will boost market sentiments and lead to an upmove on bear covering coupled with value buying.
-
The current week is crucial for the markets as the last installment of advance tax payments are due on the 15 th.
-
The index heavy-weights are showing strength again. This in turn will boost the indices and cause a feel good factor. The only worry is that this upbeat sentiment should continue. Technology stocks maybe a spoilsport in the near term. The US $ will hold the key to the tech sector.
-
Trades must be executed in small volumes due to the higher volatility expected. Trade fewer counters and conserve cash for future opportunities.
-
Standby for fresh recommendations via SMS on a real - time basis.
- Have a profitable week.
- Vijay L Bhambwani
- Ceo :- Bsplindia.com
The author is a Mumbai based investment consultant and invites feedback at Vijay@BSPLindia.com and ( 022 ) 23438482 / 23400345.
SEBI disclosure :- The author has no positions in any securities mentioned above.
- While all due care has been taken while in compiling the data enclosed herein, we cannot be held responsible for errors, if any, creeping in. Please consult an independent qualified investment advisor before taking investment decisions. This mail is not sent unsolicited, and only advisory in nature. We have accepted no consideration from any company mentioned above and recommend taking decisions on merits of the stocks from our viewpoint. This email is being sent to you as a paid subscriber. Please protect your interests and ours by not disclosing the contents to any un-authorised person/s
Legal notice :- The Professional Ticker Reader is a trademark of Bhambwani Securities (P) Ltd. and any un-authorised replication / duplication in part or full will be infringing our trademark and will result in legal action being enforced on the infringing persons / parties.