- The Professional Ticker Reader TM
- Your accurate, authentic and affordable guide to investing
Flavours of the week March 14, 2004
These are stocks that we expect to out-perform the markets. Cash and derivative strategies are advised thereon. Please stay online to enable loading of graphics from our servers. Please also read the trading tips section at the end of the newsletter.
|
Individual stocks. |
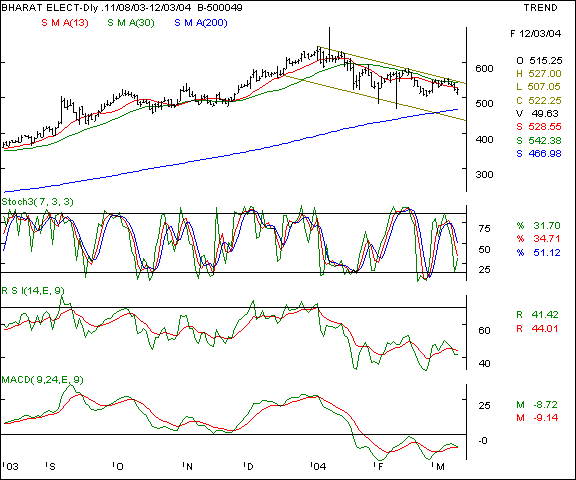
Bharat Elect - This PSU major is in a downward sloping channel and is showing signs of profit taking on advances. The stock is making lower tops and is therefore weak. The oscillators are pointing towards a weakness and the outlook is therefore of selling on rallies. We feel, there maybe an initial bullishness in the stock which is likely to be followed by selling pressure. We therefore put out a speculative sell on the counter.
Your call of action -
-
Investors / cash segment players - We suggest delivery based selling at the 540 - 545 levels with a protective stop loss at the 560 levels. Since a lower tops formation is invariably followed by a lower bottoms formation, a support at the 200 day SMA is likely at the 465 470 levels.
-
Aggressive F&O traders - Traders may sell the April futures ( quoting at Rs 4 premium to cash ) on advances of 545 with a stop loss at the 552 levels. Expect to book profits at the 536 in the near and in a weak market, even lower levels of 530 are possible.
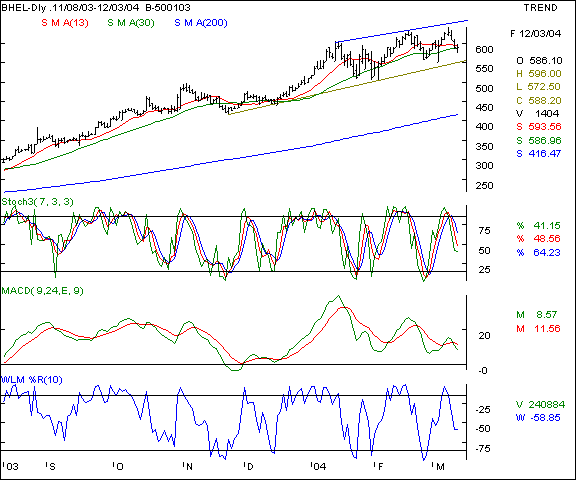
BHEL - This counter is moving in a trading range which is marked by an upward sloping channel. The scrip is making higher tops and bottoms formation and that makes the short term outlook for the scrip bullish. The scrip is a market out-performer and is likely to see buying support on declines. We recommend a buy on declines for the discerning investor / trader.
Your call of action -
-
Investors / cash segment players - Buying is recommended in small lots at the 570 levels with a room for averaging upto the 555 levels. A stop loss should be maintained at the 545 mark and exposure be taken in small lots only.
-
Aggressive F&O traders - Buy the April futures in minimal lots above the 594 levels with a stop loss at the 589 levels. Expect to book profits at the 602 - 604 in the near in a conducive market.
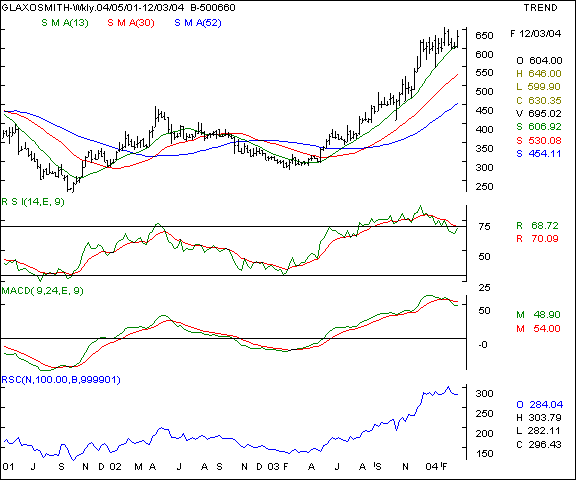
Glaxo - This MNC pharma major has more than lived up to our expectations. This company is quite simply the largest beneficiary of the EMR / product patents regime being ushered in from 2005 onwards. The merger of Burroughs Wellcome and Glaxo will create a giant in the Indian markets and give an additional edge to an already strong company. Chartically, the scrip goes into a new 4 year high above the 655 mark. We recommend a buy. The scrip is a strong market out-performer.
Your call of action -
-
Investors / cash segment players - Buy the counter at current levels with a 4 - 6 month view and maintain a liberal stop loss at the 590 mark. Expect 690 levels in a conducive market in the medium term.
-
Aggressive F&O traders - N/a
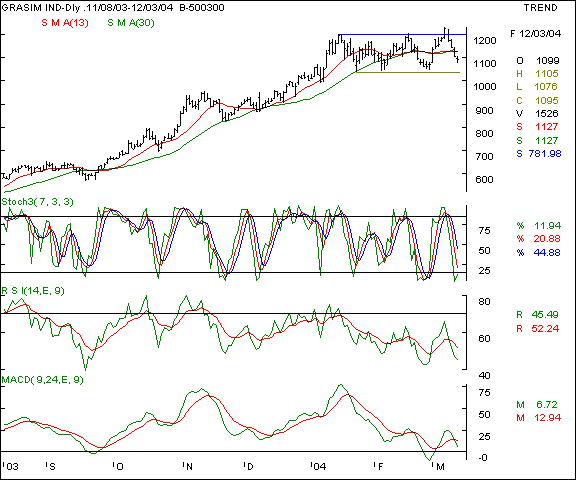
Grasim - This counter has been consolidating in a narrow channel between the 1040 and the 1200 mark. The scrip has had a superlative run upwards and is likely to see a consolidatory phase before moving higher again. We recommend a buy on declines for the counter.
Your call of action -
-
Investors / cash segment players - Buy on major declines of 1040 - 1050 only and maintain a stop loss at the 1025 levels. In a bounce-back, the scrip can go upto the 1125 mark and above. Should the market outlook become outright bullish again, we expect the 1200 mark to become a reality too.
-
Aggressive F&O traders - Buy the April futures at the 1060 levels and hold with a stop loss at the 1040 levels. Expect to take profits at the 1090 - 1100 levels in the near term. Exposure must be curtailed to minimal lots only.
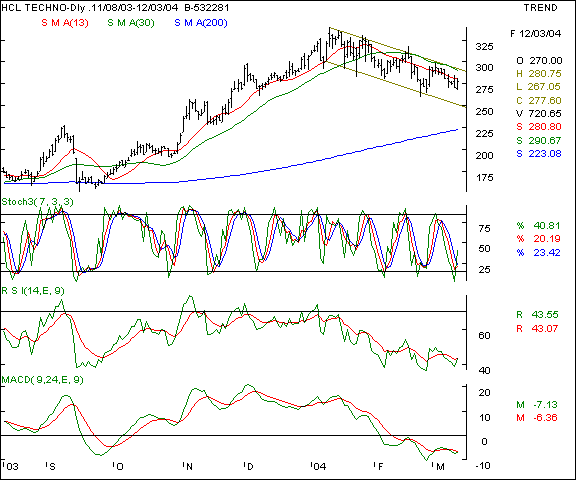
HCL Tech - This software scrip is stuck in a downward spiral and is moving in a downward sloping channel. The lower tops and bottoms formation is synonymous with the entire sectoral outlook and we recommend a speculative sell on advances.
Your call of action -
-
Investors / cash segment players - Sell the scrip for delivery at the 290 levels expect to buy back the same at the 260 - 265 mark. Maintain a stop loss at the 298 - 300 mark.
-
Aggressive F&O traders - Short the March futures on advances of 287 - 290 levels and hold with a stop-loss at the 296 levels in minimal lots only. Expect profit taking at the 270 in the near term and possibly lower in a weaker market.
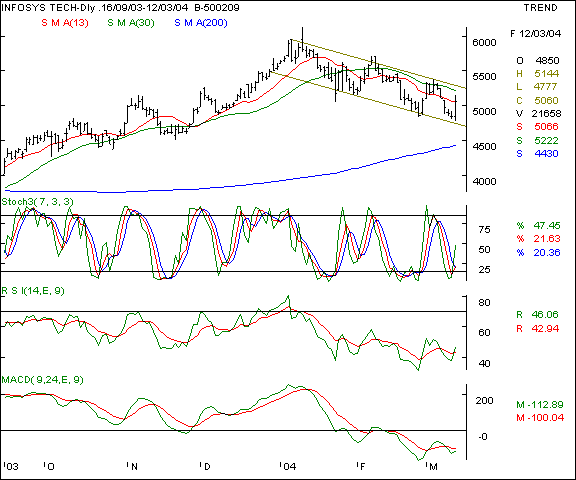
Infosys - This scrip has been moving in a downward sloping channel since 3 months and has had an unfailing tendency to fall rapidly from the upper trendline of the downward sloping channel. The oscillators are pointing towards the current rally being unsustainable and therefore short selling is advisable on higher levels for traders / speculators.
Your call of action -
-
Investors / cash segment players - Sell the scrip on advances at the 5200 - 5225 mark and hold with a stop loss at the 5320 levels. Expect to book profits at the 5070 levels in the near term and 5020 in a falling market sentiment.
-
Aggressive F&O traders - Sell the April futures ( quoting at Rs 26 premium to cash ) on major advances upto the 5175 levels and maintain with a stop loss at the 5245 levels. Expect to book profits at the 5070 mark in the absolute near term and 5020 in a conducive market in the medium term.
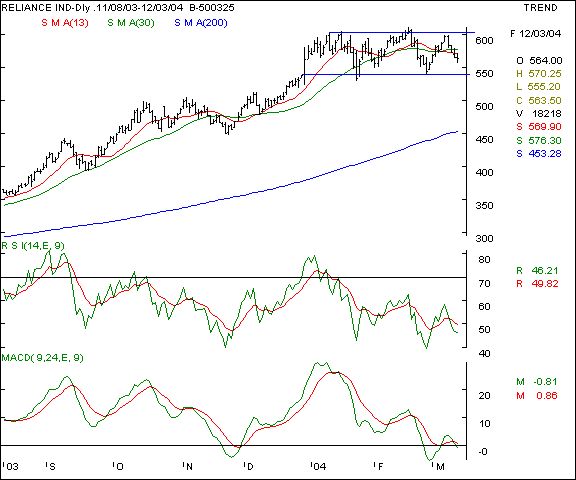
Reliance - this counter has been consolidating in the channel depicted by two parallel trend-lines since the beginning of the calendar year. The counter is capable of leading the market sentiments in either directions in the near term and therefore needs to be closely monitored for directional guidance. Should the 540 mark be violated on the downside, a head and should pattern will be confirmed and a fresh weakness is not ruled out in the absolute short term. On the upsides, the scrip turns bullish only above a sustained closing above the 600 mark with higher volumes.
Your call of action -
-
Investors / cash segment players - Buy on declines to the 545 mark and maintain a stop loss at the 535 mark. Expect a bounce to take the stock higher to the 565 mark in a conducive market.
-
Aggressive F&O traders - Buy the April futures above the 573 mark and expect to book profits at the 582 levels. Maintain a stop loss at the 568 levels. Exposure should be curtailed for now.
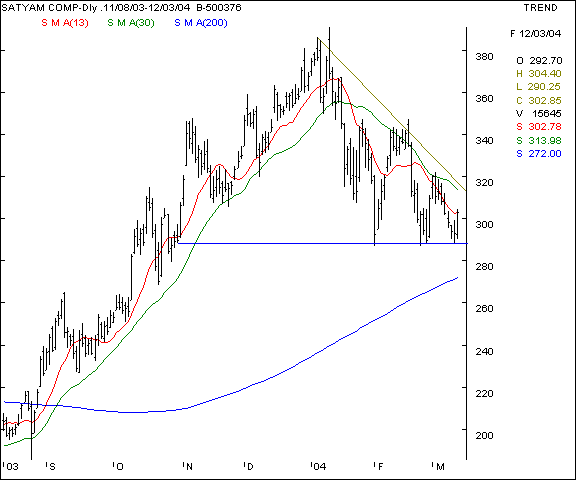
Satyam Computers - This scrip is moving in a classic triangle formation as can be observed from the chart below. The triple bottom at the 288 mark is a crucial level to watch for a bearish breakdown. On the other hand, a close above the 321 levels will see a turn in the short term sentiments in the near term. We advocate watching the 288 and the 320 levels for directional guidance in the near term and advocate taking a call in the direction of the move.
Your call of action -
-
Investors / cash segment players - Buy the scrip in very small lots at the 290 levels and maintain a stop loss at the 285 levels. Expect to book profits at the 305 levels in a firm market.
-
F&O traders - Aggressive traders can await a breakout / breakdown on the afore mentioned levels before taking a view on the markets. Options players can initiate a straddle on the counter by selling the March 260 puts at a premium of Rs 1.75 and selling the 340 calls at a premium of Rs 2 in minimal lots only.
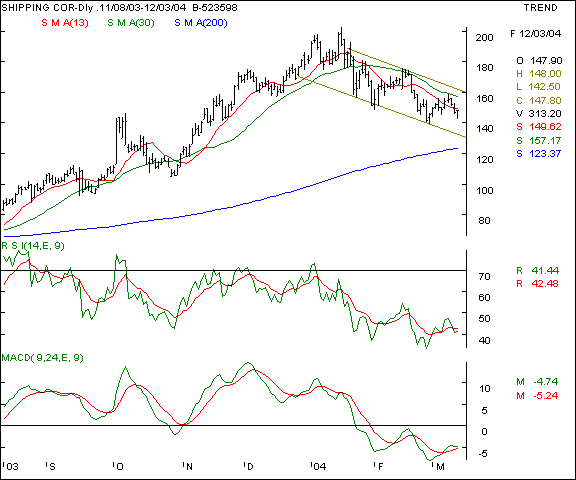
Shipping Corp - Another bearish story in the short term and a classic lower tops and bottoms formation being made on the charts. We recommend a sell on all advances for traders / speculators.
Your call of action -
-
Investors / cash segment players - Sell for delivery on significant advances upto Rs 155 levels. We expect the support on the counter to come at Rs 135 - 138 levels in a conducive market. Maintain a stop loss at the 162 levels.
-
Aggressive F&O traders - Sell the April futures at 154 levels and maintain a stop loss at the 159 levels in the coming week. Expect to book profits at the 145 levels in the near term in a conducive market. Trade should be in small lots only.
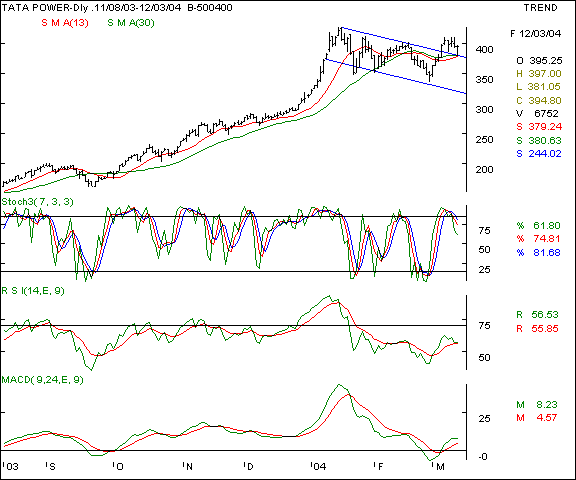
Tata Power - We had advocated a flag formation on this scrip vide our special update during the week, where a stop loss at the 380 levels was specified. The scrip has turned higher from the 381 levels and closed 4 % higher. The stock is a strong market out-performer and we recommend a buy.
Your call of action -
-
Investors / cash segment players - Buy the stock at current levels and hold with a stop loss at the 378 levels in small lots. Expect profit taking at the 415 - 420 levels in the absolute near term. In the medium term, we expect the 445 - 450 levels to be a firm possibility.
-
Aggressive F&O traders - Buy the April contracts above the 390 mark and maintain a stop loss at the 380 levels. Profit taking maybe initiated above the 410 - 412 levels. Patient traders can await much more improved levels also.
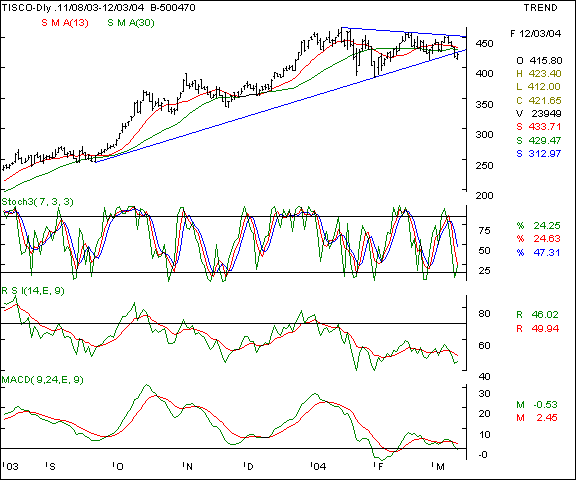
Tisco - This counter is showing signs of weakness as the tops are forming lower and the upward sloping trendline has been violated after a 6 month formation, which is a major signal. Should the scrip be unable to close above the 432 mark in the coming week, expect the stock to turn distinctly bearish in the near term. The oscillators are signalling a weakness on the counter.
Your call of action -
-
Investors / cash segment players - Sell the stock for delivery at the 435 levels and maintain a stop loss at the 444 levels. Expect the 412 / 407 levels to be a reality in a weak market.
-
Aggressive F&O traders - Sell the March 480 calls at a premium of Rs 1.50 in small lots.
|
Indices - domestic |
BSE Sensex - Last week, we predicted that the outlook for the Sensex was weak and a rally past the 6000 mark was not possible. That prediction has been justified and the markets have turned nervous. We feel the 5550 levels maybe tested as the indices are making lower tops and with poor traded volumes. The Sensex needs to close above the 5850 levels sustainably to signal a trend reversal in sentiments.
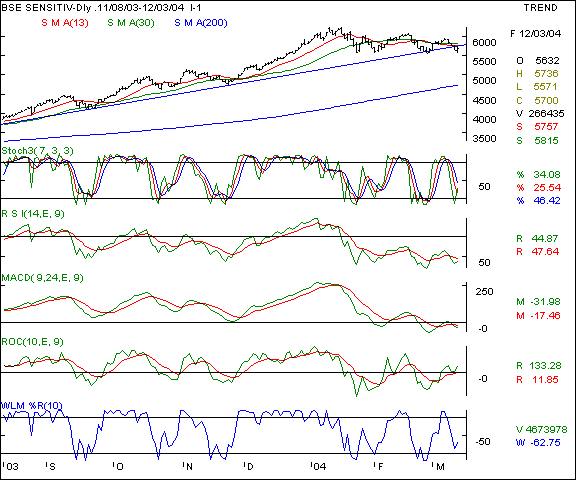
Your call of action - Since the Sensex futures are not very liquid, we suggest trading the Nifty 50 instead.
Nifty 50 - last week, we had advocated that the Nifty was expected to rally upto the 1900 levels. The index was unable to surpass those levels and has made lower tops formations since the beginning of this year. We feel the 1750 levels maybe tested in the coming fortnight if the bulls do not come and extend support to the markets at higher levels. The nervous trend will conclusively reverse only if the 1900 levels are surpassed with high volumes and positive market breadth.
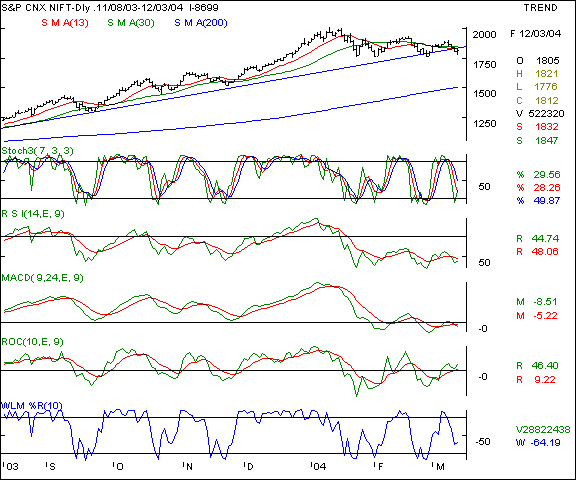
Your call of action - We advocate watching the 1750 levels for directional guidance on the lower side and the 1835 on the higher side for short term traders. Only beyond these levels, should you take a call on the markets in either direction
|
Indices - international |
Dow Jones Industrial Average - This old economy benchmark index measures the outlook on the New York stock exchange. Last week we had advocated resistance at the 10,750 levels ( click here to view our previous editions ) which proved a major hurdle for the markets. The Dow Jones has retraced from the 10,634 mark. The index is likely to remain under pressure till it surpasses the 10,500 levels with heavy volumes. Expect the 10,000 levels to be a good short term base for this index in the near term.
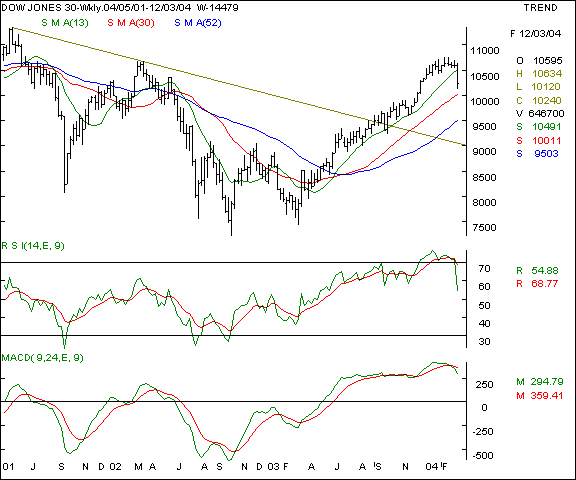
Your call of action - Since Indian investors are not allowed to trade in overseas markets, this is a pure academic study.
Nasdaq - This new economy benchmark index measures the outlook on the Nasdaq exchange. Last week, we forecast that the 2000 levels support if violated, would see a meltdown upto the 1925 mark. ( click here to view our previous editions ). Only above a 2175 close, expect the next resistance at the 2240 - 2250 levels. Till then, expect weakness in the index.
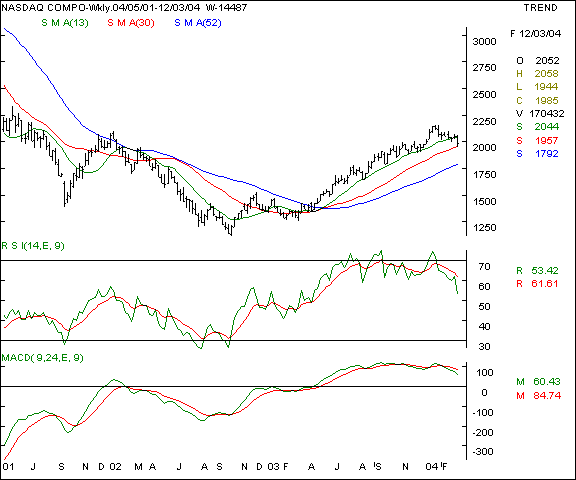
Your call of action - Since Indian investors are not allowed to trade in overseas markets, this is a pure academic study.
FTSE - This index measures the outlook on the London stock exchange. As we have been forecasting a 4300 level support, this index is making a base in the near term and showing short term weakness ( click here to view our previous editions ). Our outlook though mildly positive for this index is also that of an under-performer as compared to the US markets. The oscillators are pointing towards a sideways market at present levels - only above a conclusive close above 4560 levels, will a new rally start.
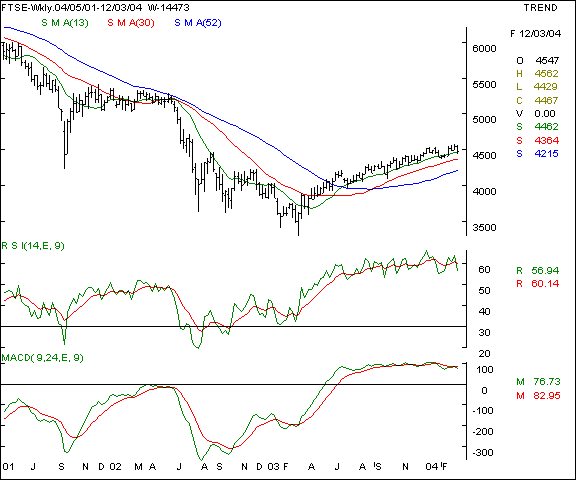
Your call of action - Since Indian investors are not allowed to trade in overseas markets, this is a pure academic study.
|
Trading tips for the week |
-
The put / call ratio is climbing and is currently at the 0.54 : 1 levels and the outstanding positions in the derivatives segment have shown a qualitative improvement. The FII investments are continuing steadily. However, the nervous is by no means over.
-
There is offloading at higher levels in stock futures. That indicates a cautious approach as long positions in individual stocks is being hedged by Nifty shorts.
-
The current week is crucial for the markets as the1750 and 5550 supports should not be violated on the indices. If that happens, expect bigger falls.
-
The index heavy-weights are showing weakness again. This in turn will drag the indices and cause a nervousness.
-
The impeding expiry of the March series will see offloading and higher volatility in the near term.
-
Trades must be executed in small volumes due to the higher volatility expected. Trade fewer counters and conserve cash for future opportunities.
-
Standby for fresh recommendations via SMS on a real - time basis.
- Have a profitable week.
- Vijay L Bhambwani
- Ceo :- Bsplindia.com
The author is a Mumbai based investment consultant and invites feedback at Vijay@BSPLindia.com and ( 022 ) 23438482 / 23400345.
SEBI disclosure :- The author has no positions in any securities mentioned above.
- While all due care has been taken while in compiling the data enclosed herein, we cannot be held responsible for errors, if any, creeping in. Please consult an independent qualified investment advisor before taking investment decisions. This mail is not sent unsolicited, and only advisory in nature. We have accepted no consideration from any company mentioned above and recommend taking decisions on merits of the stocks from our viewpoint. This email is being sent to you as a paid subscriber. Please protect your interests and ours by not disclosing the contents to any un-authorised person/s
Legal notice :- The Professional Ticker Reader is a trademark of Bhambwani Securities (P) Ltd. and any un-authorised replication / duplication in part or full will be infringing our trademark and will result in legal action being enforced on the infringing persons / parties.