- The Professional Ticker Reader TM
- Your accurate, authentic and affordable guide to investing
Flavours of the week Nov 29, 2003
These are stocks that we expect to out-perform the markets. Cash and derivative strategies are advised thereon. Please stay online to enable loading of graphics from our servers. Please also read the trading tips section at the end of the newsletter.
|
Individual stocks. |
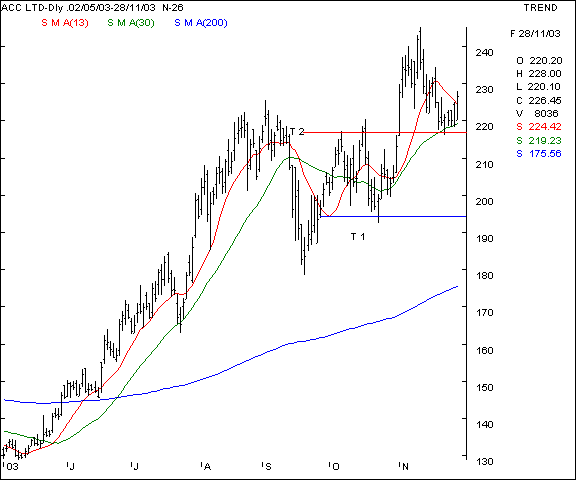
ACC - This cement major was on the brink of a breakdown below it's short term supports and has bounced back - to the pleasant surprise of the bulls. Notice the chart pattern, the previous bottom marked by trendline T-1 was at 195 levels, the next bottom made recently was a classic text book example. Notice how the support came at the previous top ( T - 2 red line ) and also the 13 day SMA was a support. The stock has closed at it's highest since the last 8 sessions and managed to clear the 13 day SMA as well. Should the markets be conducive, expect the counter to test the previous highs all over again. The stock was recommended in earlier editions dtd - 17/10/03, 31/10/03 & 7/11/03 and has been an average performer ( click here to view our previous editions )
Your call of action -
-
Investors / cash segment players - Buy the stock as long as the priceline remains above the 222 mark. Stop losses should be maintained at the 218 levels and so some room for downward averaging should be kept. Expect a price of 234 and above in a firm market.
-
Aggressive F&O traders - Buy the December futures ( trading at Rs 3 premium to cash ) above the 228 levels and maintain a stop loss at the 224 levels. Expect to book profits at the 234 - 236 levels. Options players may not be able to derive maximum benefits due to higher volatility, however, buying small lots of December calls at a strike price of 240 at a maximum premium of Rs 9. The implied volatility at these levels would be 52 %
-
Fixed income strategy - Sell the December 200 puts at a suggested premium of Rs 2 and above.
-
Derivatives contract size - Market lot = 1500 shares, F&O margin = Rs 1,00,000 = 00 approx ( margins subject to change daily ).
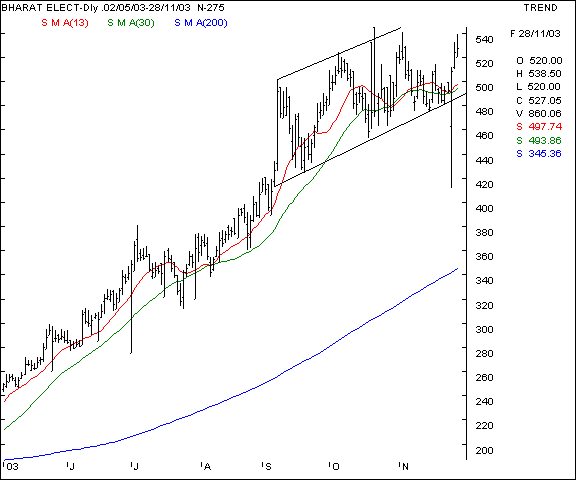
Bharat Electronics - This PSU electronics major is in a long term bull trend as the scrip has been consistently making new highs in the last five months. The stock has been remaining above it's short term moving averages ( which are up ) and the stock is in an upward sloping channel. This channel ensures support at the 485 levels and a resistance at the 565 levels. Traders can have multiple trading opportunities till a breakdown / breakout does not occur. We recommend trades on the long side for now.
Your call of action -
-
Investors / cash segment players - Buy the stock as long as the priceline remains above the 520 mark. Stop losses should be maintained at the 495 levels and so some room for downward averaging should be kept. Expect a price of 560 and above in a firm market 4 - 6 weeks down the line.
-
Aggressive F&O traders - Due to liquidity and volatility issues, we suggest trades in small lots only. Buy the December futures ( quoting at Rs 5.50 premium to cash ) in small lots on declines upto 525, keeping a stop loss at the 516 levels. Expect to book profits at the 545 levels. Options players may buy the December 540 calls at a premium of Rs 12 ( implied volatility = 35 % ).
-
Fixed income strategy - not available.
-
Derivatives contract size - Market lot = 1100 shares, F&O margins = Rs 1,05,000 approx ( margins subject to change daily ).
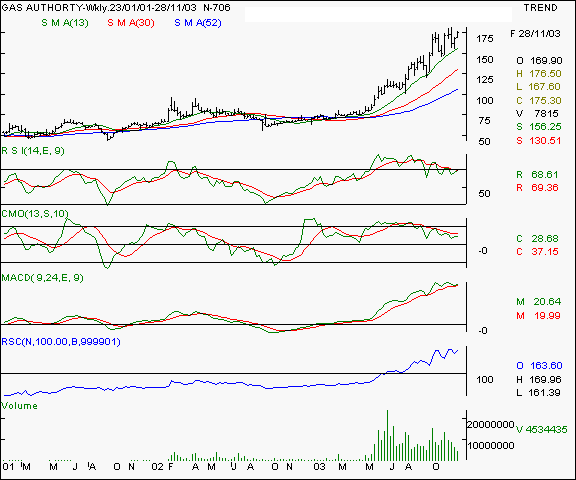
Gas Authority - this PSU gas pipeline major is undergoing a major re-rating as the stock is gaining favour with investors and FII's alike. We have been advocating this counter in the past editions dtd - 8/8/03, 14/8/03, 22/8/03, 10/10/03, 31/10/03, 7/11/03 ( click here to view our previous editions ) since the price was 130 !! The stock has been a superb performer and has yielded good profits. Any breakout above the 183 mark will propel the scrip in a new trading zone and see an accelerated upmove. The RSC ( relative strength comparative ) oscillator shows a reading of 164 - which makes this counter a market out-performer.
Your call of action -
-
Investors / cash segment players - Buy the stock once the spot price surpasses the 183 mark. Stop losses should be maintained at the 172 levels and so some room for downward averaging should be kept. Expect a price of 200 + in a firm market 4 - 6 weeks down the line.
-
Aggressive F&O traders - Buy the December futures ( quoting at Rs 2 premium to cash ) above a closing of 185 levels. Maintain a stop-loss at Rs 177 and expect to book profits at 197 - 200 by expiry in December - if the market conditions remain conducive. Options players may buy the December 180 calls at a premium of Rs 6 ( implied volatility 53 % ) in minimal lots only.
-
Fixed income strategy - not available.
-
Derivatives contract size - Market lot = 1500 shares, F&O margins approx Rs 50,000 ( margins subject to change daily ).
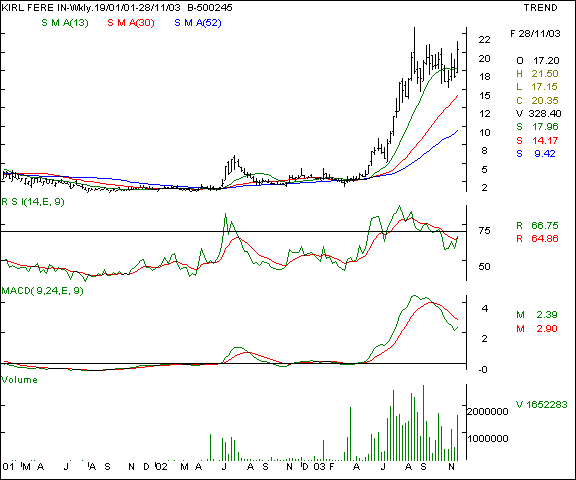
Kirloskar Ferrous - This castings and pig iron major was recommended by us in the earlier editions ( when the price was quoting at Rs 14 ) dtd 8/8/03 & 14/8/03 ( click here to view our previous editions ). This is a pure turn-around story with a reputed management, improved business environment and ongoing financial re-structuring. The company has started posting cash profits and the same is reflecting in the stock price which is entering a new low resistance zone. This stock is for the patient delivery based investor with a time frame of approximately 6 - 8 months. Our investors having enetered at Rs 14 are already in the money as the stock is up 30 % already !!! We re-iterate a buy on all declines.
Your call of action -
-
Investors / cash segment players - Buy the stock on all declines upto 17 and hold with a stop loss at the 14 - 15 levels. Expect a price of 30 and above in a firm market 6 months down the line.
-
Aggressive F&O traders - F&O not available.
-
Fixed income strategy - F&O not available.
-
Derivatives contract size - F&O not available.
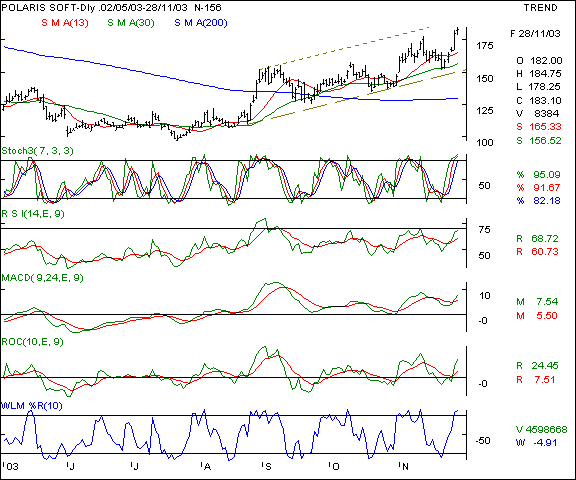
Polaris Software - This software mid-cap is in an intermediate uptrend. The company has completed the 6 sigma certification last year and is garnering market share in the EU financial solutions market. The counter is showing an upward channel formation which is over 90 days old and therefore an important indicator. The stock is currently near the upper trend-line and likely to breakout above the 185 / 186 mark. Our investors will recollect that a similar pattern was seen in NIIT some weeks ago 8/11/03 ( click here to view our previous editions ) when the stock witnessed a breakout above the 180 levels. We recommend a buy in small lots above a confirmatory breakout or a short sale if the channel top acts as a strong enough barrier.
Your call of action -
-
Investors / cash segment players - Buy the stock as and when the price breaks out above the 186 mark. Stop losses should be maintained at the 181 levels and so some room for downward averaging should be kept. Expect a price of 195 and above in a firm market 3 - 4 weeks down the line.
-
Aggressive F&O traders - Buy the December futures above a breakout above the 186 mark with a stop loss at the 181 levels and expect a profit taking at the 194 / 196 mark. However, if the scrip fails to breakout above the 186 mark, expect the scrip to fall wherein we will advise short selling via SMS / yahoo messenger.
-
Fixed income strategy - Sell the December 160 puts at a suggested premium of Rs. 3 or above in minimal lots only ( implied volatility = 57 %).
-
Derivatives contract size - Market lot = 1400 shares, F&O margins = Rs 85,000 approx ( margins subject to change daily).
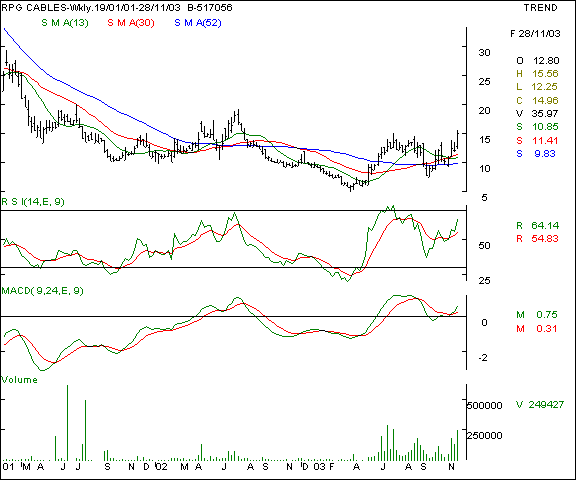
RPG Cables - This stock was recommended in our earlier edition dtd 12/7/03 ( click here to view our previous editions ) as a low priced investment with a 6 month time frame. This stock has been making gains in the last 6 months with higher volumes and has closed at it's highest levels in the last 5 months. Should this stock remain above the 15 mark consistently, expect a further upmove. The oscillators are supportive of an upmove. We recommend a buy for the patient investor with a 3 - 4 month perspective.
Your call of action -
-
Investors / cash segment players - Buy the stock as long as the priceline remains above the 15 mark. Stop losses should be maintained at the 12 levels and so some room for downward averaging should be kept. Expect a price of 20 / 22 and above in a firm market 4 - 5 months down the line.
-
Aggressive F&O traders - F&O not available.
-
Fixed income strategy - F&O not available.
-
Derivatives contract size - F&O not available.
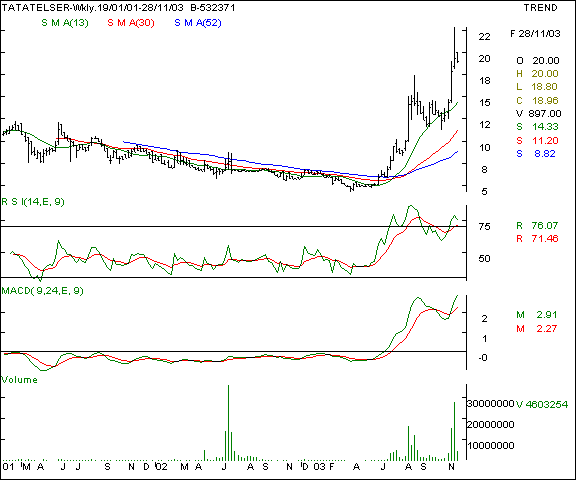
Tata Teleservices - this stock was recommended at lower levels between 12 - 14 levels and has appreciated to test the 22 levels, thereby giving over 50 % returns in 3 months. The recommended date was 8/8/03 ( click here to view our previous editions ). The main trigger has been the improved prospects for the telecom sector, unified licensing and expectations of a possibility of merging IDEA telecom with this company. The company has taken an equity stake in Dishnet DSL which will consolidate it's share in the internet market place. We re-iterate a buy on the counter on all declines for a patient investor.
Your call of action -
-
Investors / cash segment players - Buy the stock on all declines upto the 15 mark. Stop losses should be maintained at the 13 levels and so some room for downward averaging should be kept. Expect a price of 30 and above in a firm market 4 - 6 months down the line.
-
Aggressive F&O traders - F&O not available.
-
Fixed income strategy - F&O not available.
-
Derivatives contract size - F&O not available.
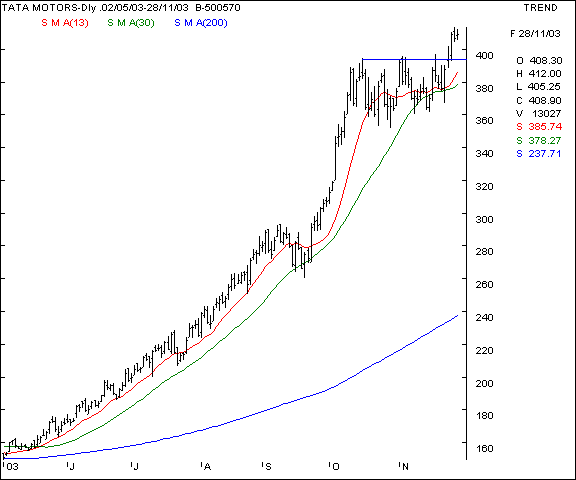
Tata Motors - this counter has been a success story on cost / operational restructuring, increased market share, exports growth and leadership in the B segment passenger car market. The commercial vehicles business being economy sensitive, the company is likely to benefit from any improvement in the economic outlook. We have been recommending this stock repeatedly and the scrip has not failed to live upto the expectations of traders and investors alike. The earlier recommendations were dtd - 13/6/03, 19/7/03, 8/803, 29/8/03, 27/9/03 and 8/11/03 ( click here to view our previous editions ) and have proven to be highly profitable. We recommend a buy for the patient investor on slight declines to the support levels indicated by the blue trendline.
Your call of action -
-
Investors / cash segment players - Buy the stock as long as the priceline remains above the 390 mark. Stop losses should be maintained at the 380 levels and so some room for downward averaging should be kept. Expect a price of 430- 435 and above in a firm market 4 - 6 weeks down the line.
-
Aggressive F&O traders - Buy the December futures ( quoting at Rs 4 premium to cash ) on declines upto 402 levels and hold with a stop loss at the 395 levels. Expect to book profits at the 420 levels in the near future in a firm market. Options players can contemplate buying the December call options at a strike price of 420 at a maximum premium of Rs 8 ( implied volatility = 31 % )
-
Fixed income strategy - Sell the December 350 puts at a premium of Rs. 2.50 or above ( implied volatility = 46 % )
-
Derivatives contract size - Market lot = 3300 shares, F&O margins approx Rs 3,25,000.
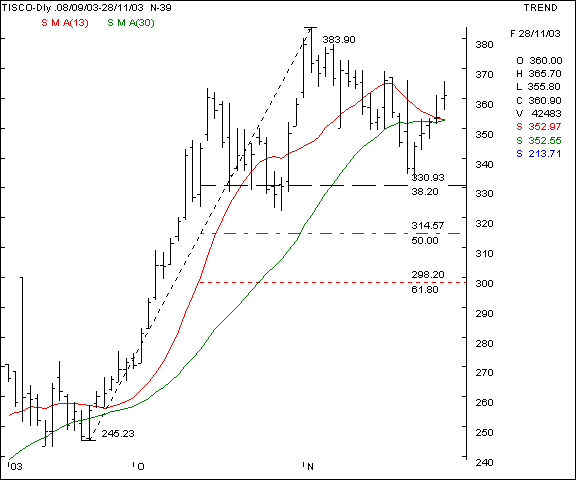
Tisco - this counter has been showing a tremendous relative strength in comparison to the broader markets as the gains made in the last 6 months have been higher than the industry peers, indices and interest rates. This stock has been repeatedly recommended by us in earlier editions dtd - 14/6/03, 28/6/03, 18/7/03, 6/9/03, 27/9/03, 4/10/03, 31/10/03 and 7/11/03 ( click here to view our previous editions ) and has returned excellent returns on investment. The scrip has made a classic bull market correction pattern and retraced 38 % from it's recent top and rallied higher. The support of 330 becomes a crucial support for the month of December where fixed income players can take a view. We recommend this scrip especially for the returns conscious investor.
Your call of action -
-
Investors / cash segment players -
-
Aggressive F&O traders - not available.
-
Fixed income strategy - Sell the December 320 puts at a premium of Rs 2.25 or higher.
-
Derivatives contract size - Market lot = 1800 shares. F&O margin = Rs 1,50,000 approx ( margins subject to change daily )
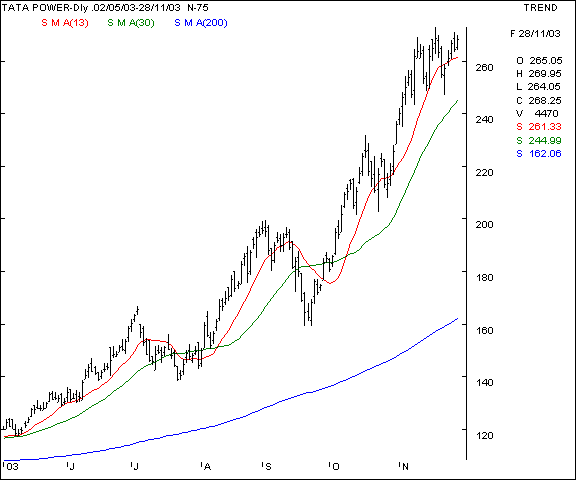
Tata Power - This power company is on a roll and is consistently making new highs as the market re-rates the sector rapidly. We foresee a defensive buying into the sector as the markets turn turbulent and a good support base at the 250 - 255 levels, should the markets come down that low. We recommend a buy on declines upto the 13 day SMA support.
Your call of action -
-
Investors / cash segment players - Delivery based buying is recommended at the 260 - 262 levels and a stop-loss be maintained at the 255 levels. Expect a profit target of 275 - 280 in the near /medium term in a firm market. Above a closing price of 273, expect a rapid upmove.
-
Aggressive F&O traders - aggressive strategy not advisable. Buy the December futures ( quoting at Rs 3 premium to cash ) on significant declines upto 260 and hold with a stop loss at the 255. Expect a profit target of 280. Options traders can buy the December 280 calls at a premium not exceeding Rs 8. ( implied Volatility 48 % )
-
Fixed income strategy - Attempt to sell the December puts at a strike price of 230 at a premium of Rs 1.40 or above ( implied volatility 45 % ).
-
Derivatives contract size - Market lot = 1600 shares. F&O margins = approx Rs 85,000 ( margins subject to daily changes)
|
Indices - domestic |
BSE Sensex - Last week we had accurately predicted that the retracement pattern of the Sensex shows a support at the 4740 levels which is where the Sensex had closed on the previous Friday. This was the 38 % fall from the absolute top of 5135. We had also re-affirmed our view that should the 4740 levels not be violated, the markets were still in a bullish trend and a close above the 4880 levels would probably see an end of the downward correction. Our forecast has been proved to be accurate and we expect the upmoves to face resistance at the 5068 then 5135 levels in the coming days. Above the 5135 mark, expect a fresh round of buying which will propel the markets in a new bullish orbit. On the lower side, expect the 4890 support to be meaningful in the coming 3 days.
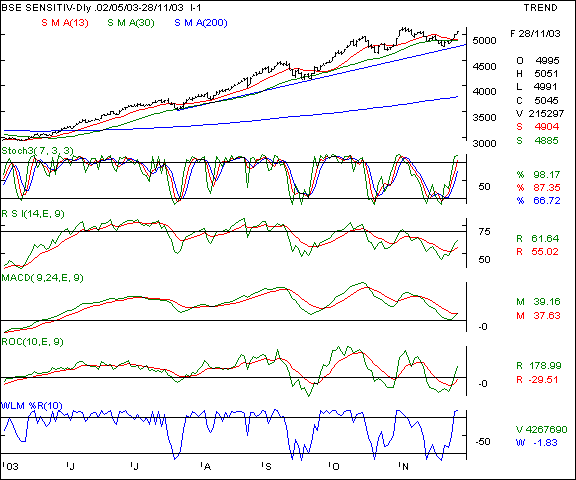
Your call of action - Since the Sensex futures are not very liquid, we suggest trading the Nifty 50 instead.
Nifty 50 - Last week, we had advocated that the Nifty was expected to show strength above any closing above the 1562 mark. That was proved accurate and the index is attempting to test it's previous high of 1635 made this month. The oscillators are showing strength and a breakout seems fairly possible in the near term. Expect resistance at the 1635, 1648 levels in the absolute near term. This index is relatively more stronger than the BSE Sensex. We recommend trading in the long side on this index.
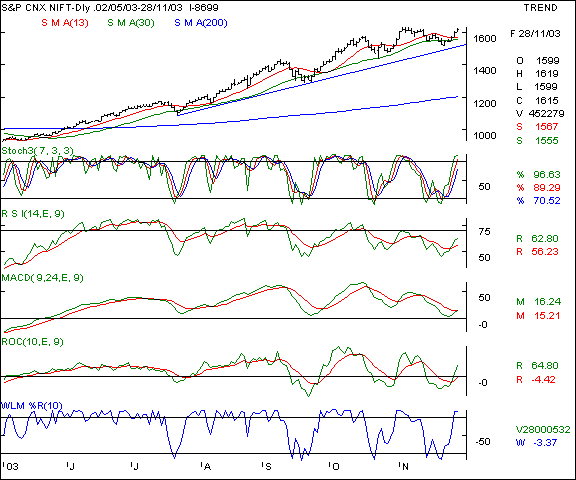
Your call of action - We advocate fresh trades on the Nifty on the long side only on declines that too in an indirect fashion by selling puts. Last weeks advise of selling December 1470 puts at a premium of Rs 15 has been highly profitable ( click here to view our previous editions ) as the current quote is Rs 5. That trade can be held till expiry. Fresh entry can be attempted in the December 1510 put series at a premium of Rs 10 or above on the sale side.
|
Indices - international |
Dow Jones Industrial Average - This old economy benchmark index measures the outlook on the New York stock exchange. The outlook for the index is range-bound on account of flight of resources from equity to bullion, year end redemptions and profit taking at higher levels. Should this index violate the 9,500 mark, expect an accelerated fall upto the 9325 levels. On the higher side, expect resistance at the 9905 levels which will be a strong inflection point.
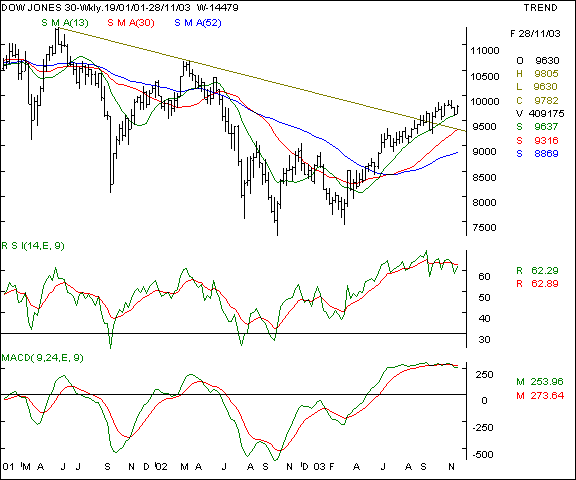
Your call of action - Since Indian investors are not allowed to trade in overseas markets, this is a pure academic study.
Nasdaq - This new economy benchmark index measures the outlook on the Nasdaq exchange. This index has made a new 22 month high recently and has been advocated by us as making a saucer formation. The relative strength of this index is significantly higher than that of the Dow and currently, even the Nasdaq is moving in tandem with the Dow. The 1900 levels will be a short term support for the markets, below which the a fresh slide to the 1820 levels is possible. On the upsides, expect resistance at the 1995 levels. Only above the 2000 mark, will the index show any signs of revival.
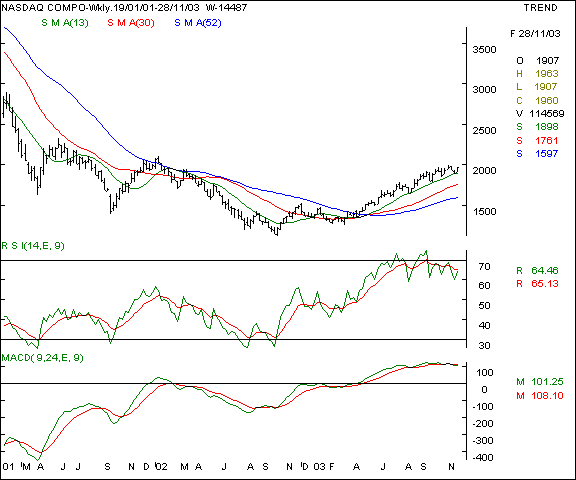
Your call of action - Since Indian investors are not allowed to trade in overseas markets, this is a pure academic study.
FTSE - This index measures the outlook on the London stock exchange. As we have been forecasting a 4400 level resistance, this index is unable to surpass that point on a closing basis and show any short term strength. The upsides will see strong selling at the 4460 levels and support at the 4290 levels. Our outlook is better for this index as compared to the Dow Jones and Nasdaq.
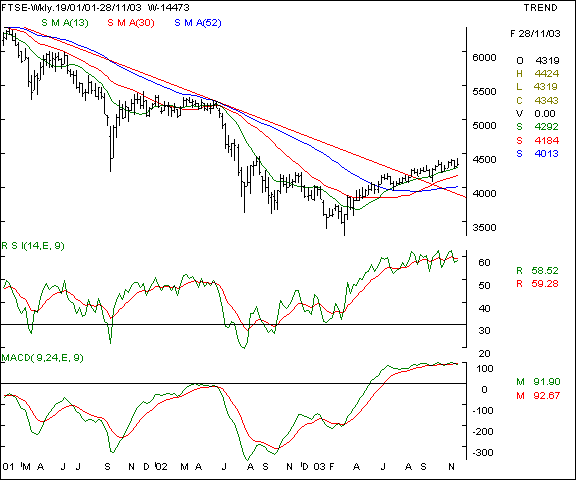
Your call of action - Since Indian investors are not allowed to trade in overseas markets, this is a pure academic study.
|
Trading tips for the week |
-
The put / call ratio has climbed to the 0.24 : 1 levels and the outstanding positions in the derivatives segment have shrunk slightly. However, this need not be construed as an immediate cause of worry. Keep watching the outstanding positions for any signs of withdrawal of funds from the markets.
-
The firm US $ has been aiding the technology sector and scrips have remained bouyant. However, a sharp reversal can occur if the US $ weakens again. Keep a close watch on the forex markets in coming days.
-
The index heavy-weights are now exhibiting signs of strength and as long Reliance, Hind Lever, Infosys, Telco, Tisco and ITC remain firm, expect the broader indices to move in tandem. Watch these counters for guidance.
-
Trade cautiously as compared to the previous week as the outlook is guarded. The undertone is slightly nervous and worries exist on slowing down of FII inflows due to christmas holidays. We have been pointing out this fact since 3 weeks.
-
The NSE imposing higher margins and cutting overall exposure levels is likely to keep the markets under pressure in the near term. Therefore abundant caution is advised.
-
Trades must be executed in small volumes and trades in the options segment must be avoided wherever the implied volatility is over 35 - 40 %.
-
We suggest a higher exposure on the steady returns segment for the coming week due to high volatility ahead.
-
Standby for fresh recommendations via SMS on a real - time basis.
- Have a profitable week.
- Vijay Bhambwani
- Ceo :- Bsplindia.com
The author is a Mumbai based investment consultant and invites feedback at Vijay@BSPLindia.com and ( 022 ) 23438482 / 23400345.
SEBI disclosure :- The author has no positions in the stocks mentioned above.
- While all due care has been taken while in compiling the data enclosed herein, we cannot be held responsible for errors, if any, creeping in. Please consult an independent qualified investment advisor before taking investment decisions. This mail is not sent unsolicited, and only advisory in nature. We have accepted no consideration from any company mentioned above and recommend taking decisions on merits of the stocks from our viewpoint. This email is being sent to you as a paid subscriber. Please protect your interests and ours by not disclosing the contents to any un-authorised person/s
Legal notice :- The Professional Ticker Reader is a trademark of Bhambwani Securities (P) Ltd. and any un-authorised replication / duplication in part or full will be infringing our trademark and will result in legal action being enforced on the infringing persons / parties.