- The Professional Ticker Reader TM
- Your accurate, authentic and affordable guide to investing
Flavours of the week Sept 04, 2004
These are stocks that we expect to out-perform the markets. Cash and derivative strategies are advised thereon. Please stay online to enable loading of graphics from our servers. Please also read the trading tips section at the end of the newsletter.
|
Individual stocks. |
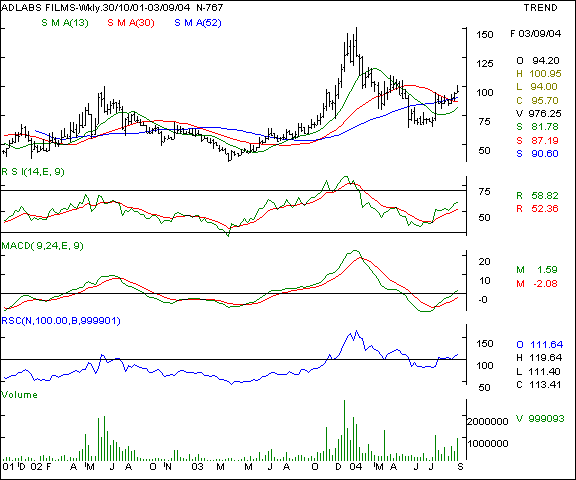
Adlabs - this media player is showing signs of a classic higher bottoms formation as the graphic shows. The 91 level was a resistance area which the scrip had surpassed on a closing basis during the week gone by. The traded volumes are up and the oscillators are supporting the upmove. The scrip is turning into a market out-performer and the sector itself is being re-rated upwards. We recommend a buy on advances for the mid cap players.
Your call of action -
-
Investors / cash segment players - Buy the scrip for delivery above the 98 mark and hold with a stop loss at the 91 / 92 levels. Expect to start profit taking at the 110 levels and square up long positions completely at 115 levels.
-
Aggressive F&O traders - derivatives n/a
-
Derivatives contract size - n/a.
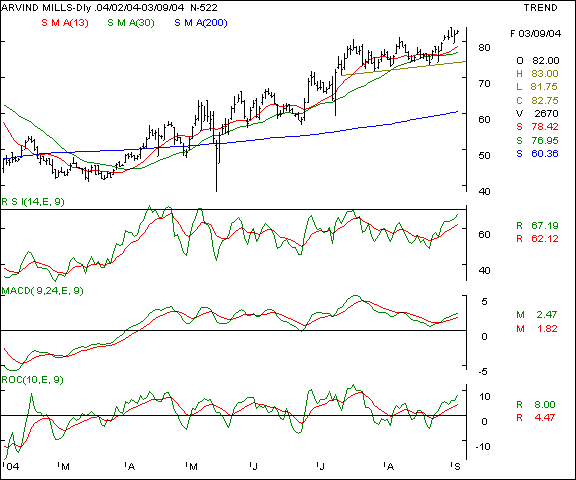
Arvind Mills - This denim / cotton textiles player is a regular feature of this newsletter and has lived up to our expectations as the scrip has achieved it's first target of 84 levels and is still ruling firm. The softening cotton prices are a positive trigger for the counter and the and we re-affirm our buy on declines view. The oscillators are pointing towards a continued upmove and a undertone is likely to remain firm in the short / medium term.
Your call of action -
-
Investors / cash segment players - the existing long positions if any, can be held with a target of 88 in the near term. Earlier positions maybe held with a stop loss at the 78 levels. Fresh long positions maybe initiated only on significant declines to the 78 - 79 levels, with a stop loss at the 74 mark and a target of 84 be maintained.
-
Aggressive F&O traders - Buy the September futures on a breakout above the 84 mark and hold with a stop loss at the 81.50 levels. Expect to book profits at the 88 / 89 levels in the near term in a conducive market.
-
Derivatives contract size - Market lot = 4,300 shares, F&O margins = approx Rs 60,000 ( subject to change daily ).
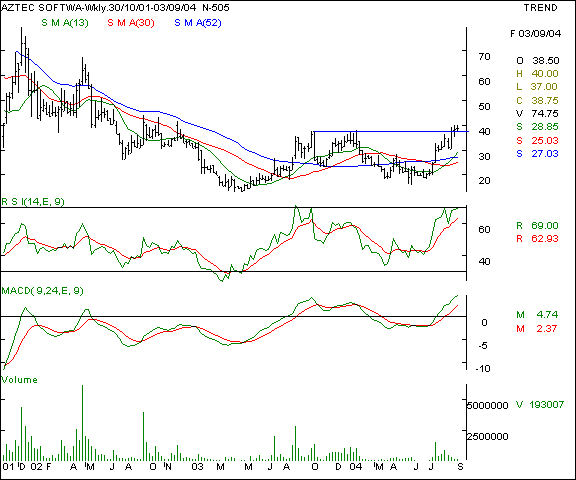
Aztec Software - this scrip recommended recently has triggered a buy signal after it surpassed the 52 week high in recent times. The traded volumes are slightly sparse and that makes this stock higher risk. The counter must stay above the 34 mark for the uptrend to continue. The oscillators are pointing towards a further upside in a firm market and we recommend a buy in small lots for the mid cap players.
Your call of action -
-
Investors / cash segment players - Buy at current levels ( 38 ) and stay long in the counter in small lots as long as the scrip is above the 34 / 35 mark and maintain a stop at the 33 levels. Expect the upper target to be at the 44 / 45 levels in a conducive market.
-
Aggressive F&O traders - F&O n/a.
-
Derivatives contract size - F&O n/a.
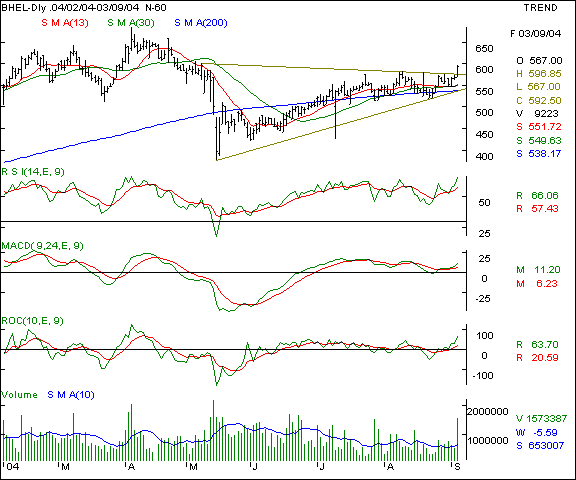
BHEL - This PSU electricals major is showing signs of a breakout of a bullish triangle and that too with higher volumes. Traders may please note that the volumes window is superimposed with a 10 day average volumes level. The breakout is accompanied by volumes twice over the 10 day average and that makes this counter a reasonably good trading bet in a conducive market. The momentum oscillators are confirming the rally and we recommend a trading buy for short term players. Traditional resistance will be at the 605 levels first and time / price analysis suggests a level of 622 in the near term in a conducive market
Your call of action -
-
Investors / cash segment players - Delivery players may buy the scrip at the 585 levels and hold with a stop loss at the 573 levels. Expect to book profits at the 605 atleast partially and liquidate the entire long positions at the 618 levels
-
Aggressive F&O traders - Buy the September futures at the 580 levels ( quoting at Rs 7 discount to cash ) and hold with a stop loss at the 575 levels. Expect to book profits at the 588 levels and offload completely at the 593 levels. Income based players can sell the September 540 puts at Rs 6 and above in small lots.
-
Derivatives contract size - Market lot = 600 shares, F&O margins = approx Rs 57,000 ( subject to change daily ).
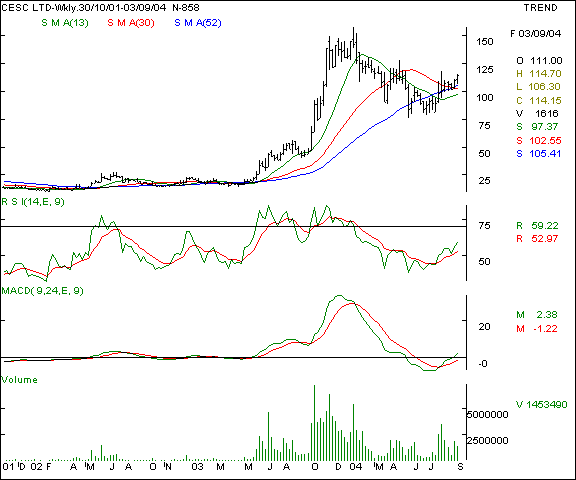
CESC - this bengal based power company is in the news for the right reasons for now. There is aggressive restructuring of expensive debt and operations are being streamlined. The markets are giving a thumbs up to the development and the share price is moving up in a rounding bottom formation with reasonably good volumes. The scrip has closed above it's 20 week high which is a sign of strength. The oscillators are showing a sign of strength and any closing above the 118 levels will confirm a bullish pattern on the momentum oscillators. We recommend a buy in small / medium lots for the mid cap players.
Your call of action -
-
Investors / cash segment players - Buy the scrip at current levels and hold with a stop loss at the 102 levels and expect to book profits at the 125 levels in the near term. Should the markets remain firm, we expect higher levels of 132 levels as a possibility.
-
Aggressive F&O traders - F&O n/a.
-
Derivatives contract size - F&O n/a
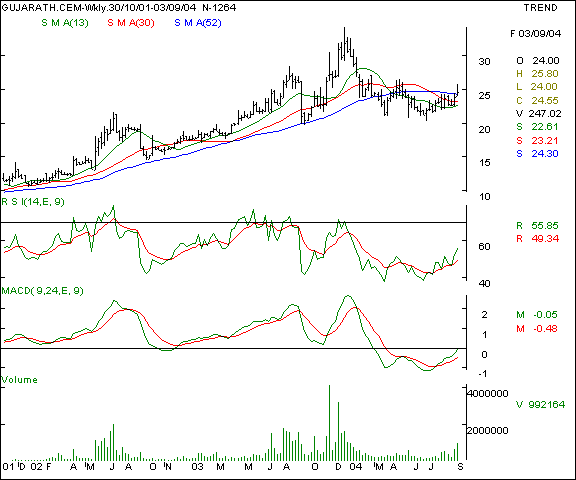
Gujarat Cements - this low priced cement scrip has given a breakout above it's 52 week average and that too with higher volumes. The scrip is exhibiting a saucer type formation in the making and any close above the 27 levels will confirm the short term upmove.
Your call of action -
-
Investors / cash segment players - buy the scrip as long as it remains above the 25 levels and hold with a stop loss at the 21.50 levels. Expect to book profits at the 28 / 29 levels in a conducive market.
-
Aggressive F&O traders - F&O n/a.
-
Derivatives contract size - F&O n/a.
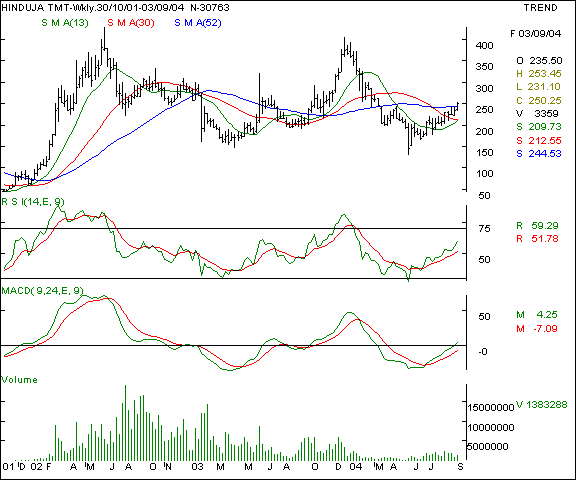
Hinduja TMT - This technology scrip has shown high volatility in the recent past and managed to close above it's 52 week SMA after Feb 2004 for the first time. The oscillators are indicating a buildup of bullish momentum as the traded volumes remain subdued. Higher risk traders can buy in small lots for short term trades.
Your call of action -
-
Investors / cash segment players - Buy the scrip above the 255 mark and hold with a stop loss at the 245 mark. Expect to book profits at the 267 in the near term and higher levels of 272 maybe likely in a firm market.
-
Aggressive F&O traders - F&O n/a.
-
Derivatives contract size - F&O n/a.
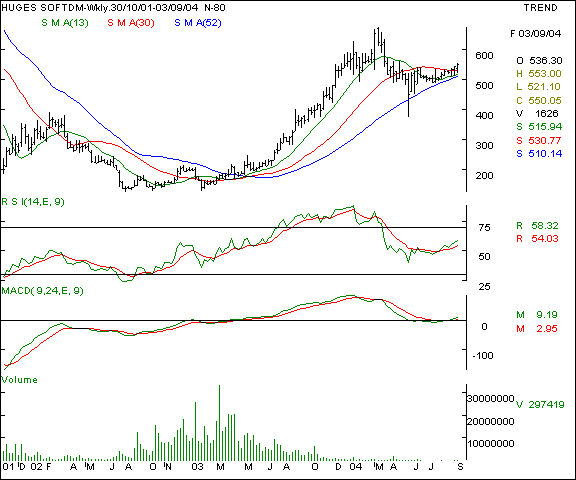
Hughes Software - This software major has completed it's consolidation phase and started moving higher. It is noticeable that the price line has not fallen below the 52 week SMA which is at the 510 levels. The scrip is likely to gain upward momentum once the 565 levels are surpassed on a continued closing basis with higher volumes. We recommend a buy on advances, which will be a confirmatory signal
Your call of action -
-
Investors / cash segment players - Buy the scrip at current levels as long as the market is firm and the scrip stays above the 538 levels. Maintain a stop loss at the 535 levels and expect to book partial profits at the 564 levels and square up long positions completely at the 568 levels.
-
Aggressive F&O traders - F&O n/a.
-
Derivatives contract size - F&O n/a.
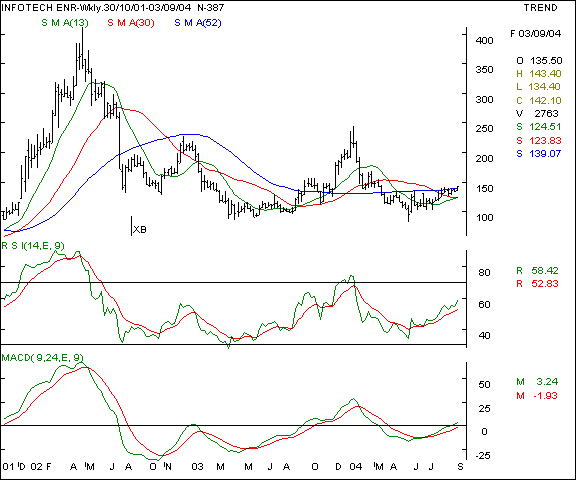
Infotech Enterprises - this mid cap story is showing promise as the scrip is making a saucer formation and the same is confirmed by the oscillators which are getting into the buy mode. The scrip has managed to close above the 52 week SMA and the traded volumes have been fair. A buy on advances is recommended as the upward momentum is likely to accelerate at higher levels.
Your call of action -
-
Investors / cash segment players - Buy the scrip in small lots at current levels and average upwards as the scrip manages to close above the 145 levels. A stop loss at the 136 is recommended and a profit target at the 156 - 160 is advocated. Keep traded volumes under check as this is a volatile counter.
-
Aggressive F&O traders - F&O n/a.
-
Derivatives contract size - F&O n/a.
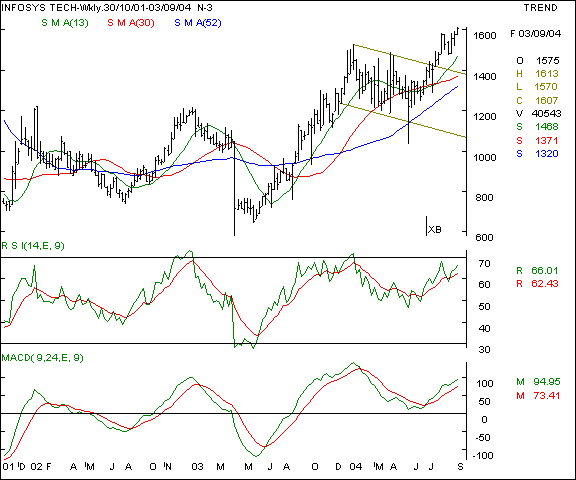
Infosys - This scrip was recommended earlier with a target price at Rs 1600 - 1625 levels - which it achieved. The upsides are likely to extend after a consolidation phase and we recommend a buy on declines for the patient investor / trader.
Your call of action -
-
Investors / cash segment players - buy the scrip for delivery at lower levels of 1540 - 1550 and hold with a stop loss at the 1510. Expect to book profits at the 1640 levels in the short /medium term.
-
Aggressive F&O traders - Buy the September futures on declines at the 1575 and hold with a stop loss at the 1540 levels. Expect profit taking at the 1640 in the near term. Income players can sell the Sept 1500 puts at a premium of Rs 10 and above.
-
Derivatives contract size - Market lot = 200 shares. F&O margin = approx Rs 54,000 (subject to change daily )
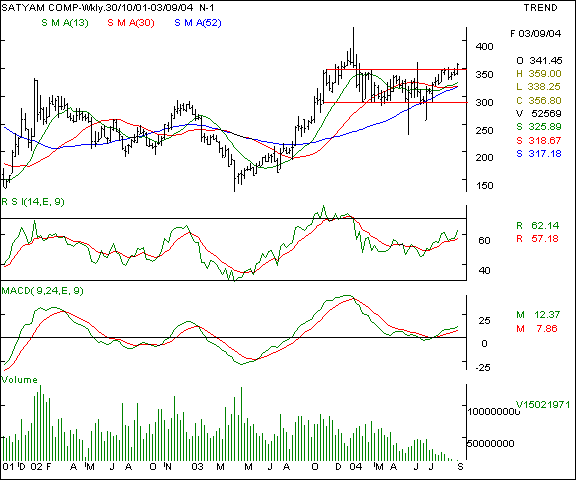
Satyam Computers - this software major has signalled a breakout of a 52 week congestion channel and managed to close above this channel albeit with poor volumes. Should the traded volumes perk up and the counter maintains levels above the 347 mark, expect the upsides to be till the 365 - 368 in conducive market. We recommend a trading buy in small lots for the higher risk traders. Once the volumes pick up, exposure maybe enhanced.
Your call of action -
-
Investors / cash segment players - buy the scrip for delivery at current levels in small lots and hold with a stop loss at the 344 levels. Expect profit taking at the 366 - 368 levels.
-
Aggressive F&O traders - Buy the September futures at the current levels and maintain a Rs 3 stop loss. Expect a profit motive of Rs 6 - 8 in the short term. Income players can attempt to sell the Sept 310 puts at a premium of Rs 1.25 and above.
-
Derivatives contract size - Market lot = 1,200 shares. F&O margin = approx Rs 70,000 (subject to change daily )
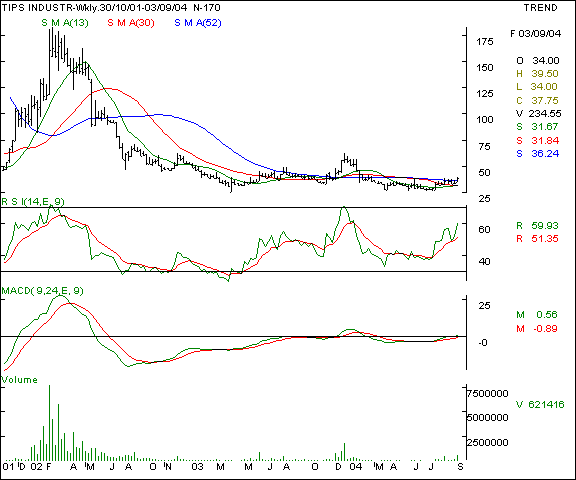
Tips Industries - This entertainment company is showing signs of revival on the charts as the volumes are showing a small pick up and the price is inching higher. The oscillators are showing rising upward momentum and the scrip is trading above the 52 week SMA for now. Should the stock stay above the 38 levels, a 15 - 20 % upmove would be a distinct possibility in the near term. We recommend a speculative buy on the counter.
Your call of action -
-
Investors / cash segment players - Buy the scrip above the 38 levels and hold with a stop loss at the 33 levels. Expect to book profits at the 44 - 46 levels. Since this is a higher risk trade, keep quantities small.
-
Aggressive F&O traders - F&O n/a
-
Derivatives contract size - F&O n/a
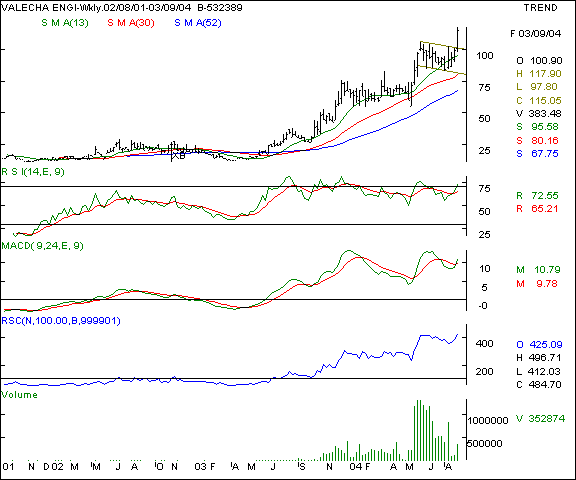
Valecha Engg - This scrip has exhibited a breakout with a sharp rise in traded volumes. The downward sloping channel is a flag formation as the breakout has confirmed the measuring move. The upper target is the 125 - 130 levels as the flag formation implies, in the immediate future. The scrip has a very high relative strength as compared to the sensex as the RSC oscillator shows.
Your call of action -
-
Investors / cash segment players - Buy the scrip on a small dip at the 110 levels and hold with a stop loss at the 98 levels. Expect to book profits at the 125 levels in the near term and possibly higher in the medium term.
-
Aggressive F&O traders - F&O n/a.
-
Derivatives contract size - F&O n/a
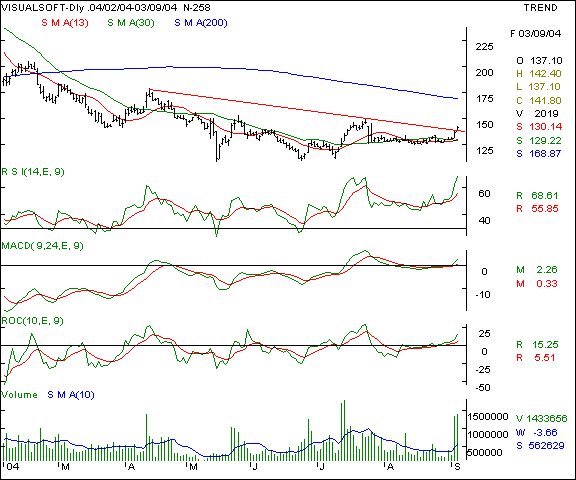
Visual Software - This erstwhile tech favourite has exhibited a breakout pattern with a surge in volumes as the volume window shows a three fold increase in traded volumes as compared to the 10 day average. The downward sloping trendline resistance has been surpassed and the scrip is likely to head higher in the near term.
Your call of action -
-
Investors / cash segment players - Buy the scrip in small lots at current levels and hold with a stop loss at the 134 levels. Expect immediate resistance at the 149 / 150 levels where 50 % profits can be booked. Square up completely at the 155 - 157 levels.
-
Aggressive F&O traders - F&O n/a.
-
Derivatives contract size - F&O n/a
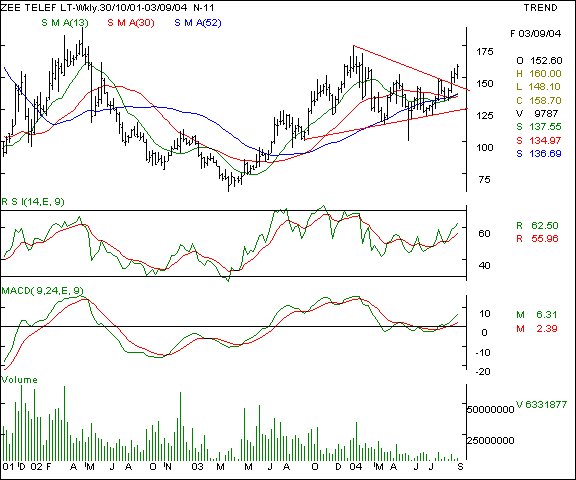
Zee Telefilms - This media house counter recommended last week has performed as per expectations. The trigger has been the re-rating of the sector and the bid for the cricket cup. The breakout from a short term wedge has been accompanied by lower volumes and therefore we feel the upsides are likely to be limited from here. We recommend a hold for existing positions and a fresh buy for short term traders in small lots only.
Your call of action -
-
Investors / cash segment players - Hold the previous weeks long positions till the 164 levels and buy afresh only on minor declines at the 154 / 155 levels in very small lots only. Hold fresh positions with a stop loss at the 150 levels and expect to book profits at the 160 levels. Fresh purchases should be contemplated in very small lots only.
-
Aggressive F&O traders - F&O n/a.
-
Derivatives contract size - F&O n/a.
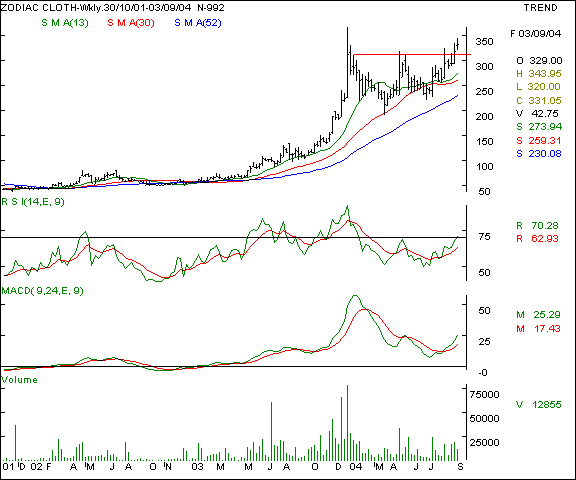
Zodiac Clothing - This scrip was recommended as a buy recently above a close of 320 levels and the same has been with steady volumes. We re-affirm our buy recommendation on this counter and advise patient investors to maintain their holdings for atleast 6 months on the counter. The dropping cotton prices are likely to add to the bottomline of this scrip. Since this counter is not very liquid, we advocate small positions on this counter.
Your call of action -
-
Investors / cash segment players - Buy above the 320 levels and maintain a liberal stop loss at the 280 levels. Expect to book profits at the 375 partly and maintain the remaining in the portfolio.
-
Aggressive F&O traders - F&O n/a
-
Derivatives contract size - F&O n/a
|
Indices - domestic |
BSE Sensex - The benchmark index is showing a range bound trade within an upward sloping channel where the support is at the 5140 levels. On the higher side, an upmove is likely only above a sustained closing above the 5245 levels with higher volumes. The oscillators are showing an upward bias which will be a positive factor in the coming week.
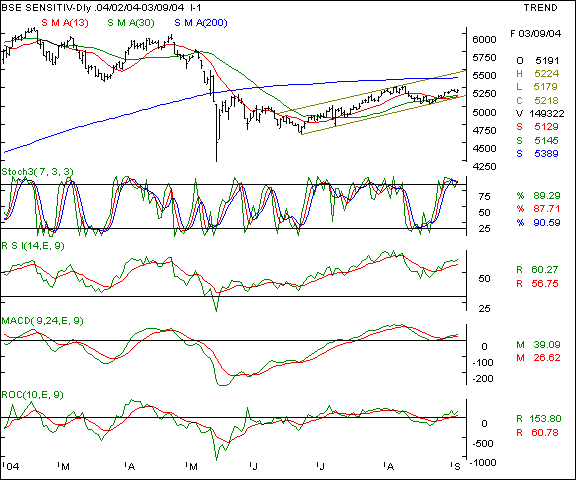
Your call of action - Since the Sensex futures are not very liquid, we suggest trading the Nifty 50 instead.
Nifty 50 - The Nifty is making similar chart patterns and the downside support is at the 1603 levels in the coming week, below which the outlook is likely to turn bearish. The upsides will se resistance at the 1669 levels above which only, will a fresh sustainable upmove be possible. It is noteworthy that the index which is gyrating in a higher tops and bottoms formation since June ' 04 should not close below the 1574 levels in the coming week. That fall will violate the rising trend. The upper targets in the coming days are the 1644 & 1665 levels.
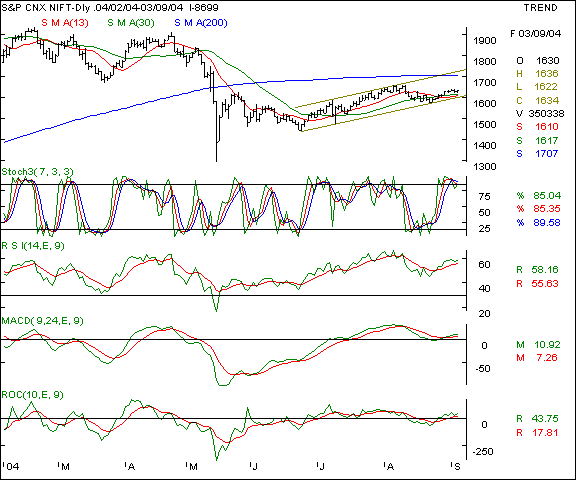
Your call of action - initiate bullish positions as long as the Nifty remains above the 1635 levels and hold with a stop loss at the 1622 levels. Expect resistance at the 1644 and then at the 1664 levels. Note - levels mentioned are spot rates.
|
Indices - international |
Dow Jones Industrial Average - as mentioned in the previous week, the index has faced resistance at it's upper trendline of the downward sloping channel and closed at it's 30 week SMA. Upsides are likely to be capped at the 10,370 in the near term. The floor is at the 10025 levels in the coming week.
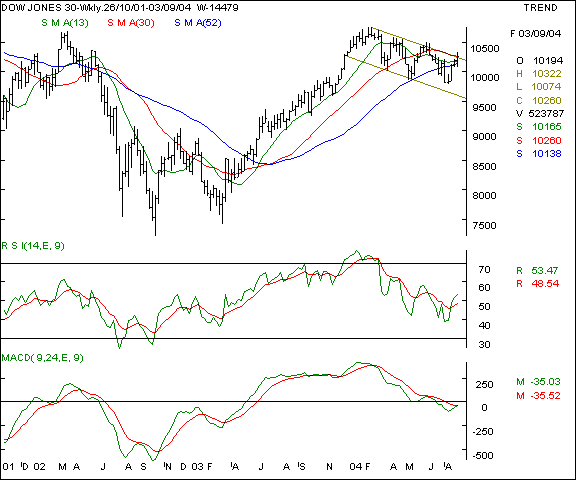
Your call of action - Since Indian investors are not allowed to trade in overseas markets, this is a pure academic study.
Nasdaq - The tech and bio tech heavy Nasdaq is showing a weaker outlook as compared to the Dow and the index is unable to surpass the short term averages. The oscillators are in a sell mode and point towards a further weakness. The upsides are likely to be capped at the 1900 levels and the foor is likely at the 1785 levels in the near term.
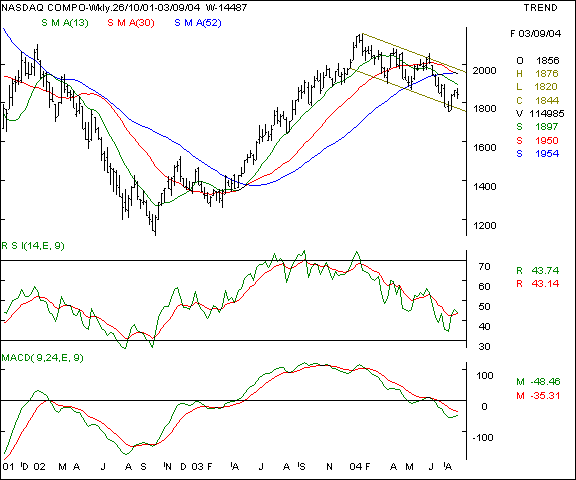
Your call of action - Since Indian investors are not allowed to trade in overseas markets, this is a pure academic study.
FTSE - This UK benchmark is showing higher relative strength as compared to the US indices. Should the upward momentum continue, we expect a further 1.5 % upsides to the 4610 levels. On the lower side, the 4420 levels will be a strong support in the coming week.
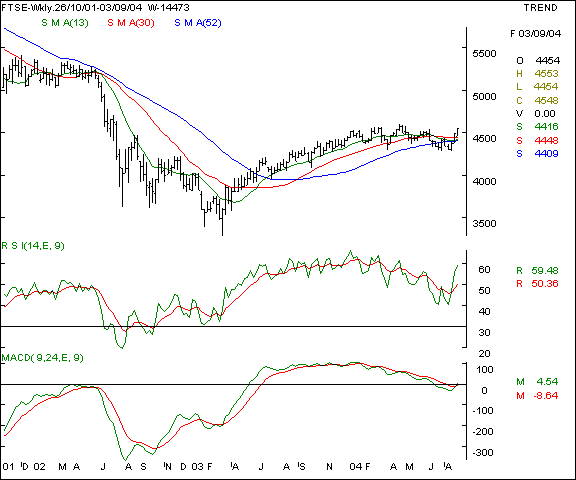
Your call of action - Since Indian investors are not allowed to trade in overseas markets, this is a pure academic study.
|
Trading tips for the week |
-
The put / call ratio is climbing and is currently at the 0.42 : 1 levels and the outstanding positions in the derivatives segment have shown a rise on a week-on-week basis. The FII investments are continuing steadily.
-
There is offloading at higher levels in stock futures. That indicates a cautious approach as long positions in individual stocks is being hedged by Nifty shorts.
-
The index heavy-weights are showing strength again. This in turn will boost the indices and cause a feel good factor. The only worry is that this upbeat sentiment should continue.
-
Trades must be executed in small volumes due to the higher volatility expected. Trade fewer counters and conserve cash for future opportunities.
-
Standby for fresh recommendations via SMS on a real - time basis.
- Have a profitable week.
- Vijay L Bhambwani
- Ceo :- Bsplindia.com
The author is a Mumbai based investment consultant and invites feedback at Vijay@BSPLindia.com and ( 022 ) 23438482 / 23400345.
SEBI disclosure :- The author has no positions in any securities mentioned above.
- While all due care has been taken while in compiling the data enclosed herein, we cannot be held responsible for errors, if any, creeping in. Please consult an independent qualified investment advisor before taking investment decisions. This mail is not sent unsolicited, and only advisory in nature. We have accepted no consideration from any company mentioned above and recommend taking decisions on merits of the stocks from our viewpoint. This email is being sent to you as a paid subscriber. Please protect your interests and ours by not disclosing the contents to any un-authorised person/s
Legal notice :- The Professional Ticker Reader is a trademark of Bhambwani Securities (P) Ltd. and any un-authorised replication / duplication in part or full will be infringing our trademark and will result in legal action being enforced on the infringing persons / parties.