- The Professional Ticker Reader TM
- Your accurate, authentic and affordable guide to investing
Flavours of the week Sept 25, 2004
These are stocks that we expect to out-perform the markets. Cash and derivative strategies are advised thereon. Please stay online to enable loading of graphics from our servers. Please also read the trading tips section at the end of the newsletter.
|
Individual stocks. |
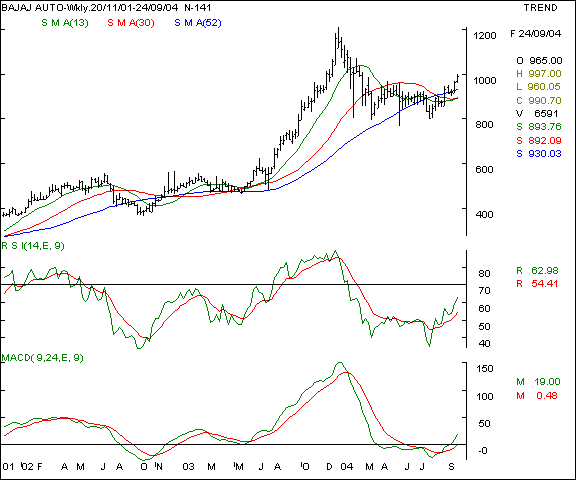
Bajaj Auto - this 2 wheeler major has been in a bullish groove as the chart indicates. The stock is a market out-performer, very high relative strength and an institutional favourite. The scrip has broken out of a 5 month old congestion zone and is headed for a lower resistance area trading where relatively smaller buying interest can push up prices. Fundamentally too, the company is giving a tough time to Hero Honda which is it's nearest rival. We recommend a buy on this counter for the patient and discerning investor.
Your call of action -
-
Investors / cash segment players - buy at the 975 levels and hold with a stop loss at the 920 levels. Expect profit taking at the 1120 levels in 8 - 12 weeks in a conducive market in the near term.
-
Aggressive F&O traders - Buy the October futures at the 980 levels ( quoting at Rs 5 discount to cash ) and hold with a stop loss at the 945 levels. Expect to book profits at the 1030 - 1045 levels in a month in a conducive market. Options traders have little or not choice due to liquidity problems.
-
Derivatives contract size - Market lot = 400 shares, F&O margins = approx Rs 62,000 ( subject to change daily ).
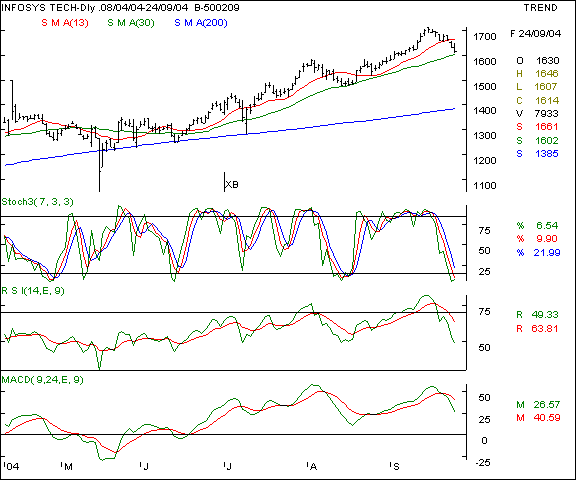
Infosys - This software bell-weather is in a correction / consolidation mode as the chart shows a minor dip in the price graph. The impeding results will see the routine pre-result build up of positions which will see higher volatility and polarised action on this sector on the whole. The noteworthy aspect is the fact that this counter has a proven support at the 30 day SMA which has been an unfailing turning point on corrective falls. Should that support hold, we expect the rising tops and bottoms formation to see 1720 and higher in the coming weeks. The positive trigger for this sector is the weakening Rupee which strengthens the bottomline.
Your call of action -
-
Investors / cash segment players - Buy for delivery at the 1600 levels and maintain a stop loss at the 1540 levels. Expect profit taking at / above the 1720 levels in a conducive market in the short / medium term.
-
Aggressive F&O traders - Buy the October futures ( quoting at Rs 11 premium to cash ) at the the 1610 levels and hold with a stop loss at the 1560 levels. Expect profit taking at the 1680 in the near term, with a possibility of 1710 and above in the pre-result scenario. Options players can buy the Oct 1710 calls at a premium of Rs 28.
-
Derivatives contract size - Market lot = 200 shares, F&O margins = approx Rs 55,000 ( subject to change daily ).
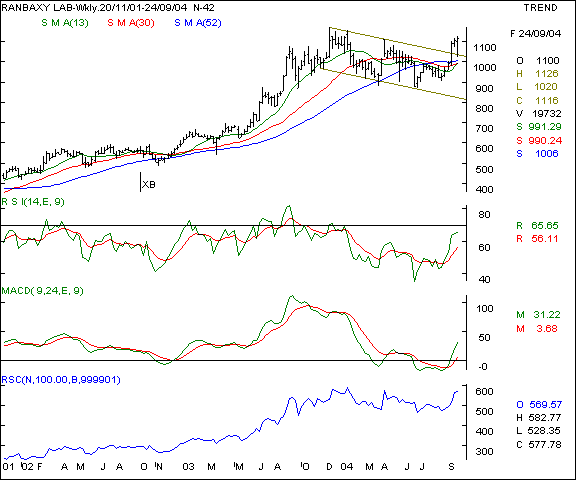
Ranbaxy - This Indian MNC pharmaceutical bell-weather has long been advocated by us as a market out-performer. The scrip has a very high relative strength and the chart formation shows a breakout from a downward sloping channel. In technical parlance, such a downward slope after a bullish phase is known as a Flag formation, which is also a measuring move. It is possible to forecast the upsides after a breakout which occurred at the 1035 levels. The downward move from the 1100 levels in Oct / Nov ' 03 to the 850 levels in May 05 was a correction of Rs 250 within this bearish channel. A breakout therefore will see an upside of Rs 250 ( approximately ) from the 1035 levels. It should be noted that pharmaceutical stocks are perceived as a defensive play in a volatile market and this counter may actually gain in case of a market fall. A buy is commended on declines for the patient and discerning investors.
Your call of action -
-
Investors / cash segment players - Buy at the 1075 levels and hold with a stop loss at the 1030 levels. Expect profit taking at the 1180 in the near term in a conducive market and 1250 and above in 4-6 months.
-
Aggressive F&O traders - Buy the Oct futures at minor declines at the 1070 levels and hold with a stoploss at the 1030 levels. Expect profit taking at the 1160 levels in the near term and Rs 1220 and above by the end of Oct series in an exceptionally bullish market.
-
Derivatives contract size - Market lot = 400 shares, F&O margins = approx Rs 75,000 ( subject to change daily ).
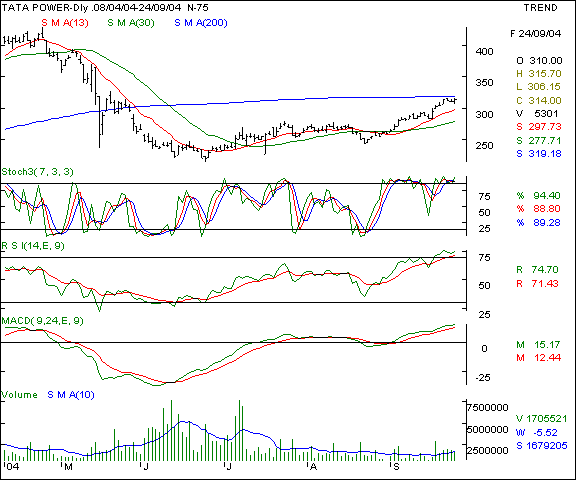
Tata Power - this power major is showing signs of strength as the last few weeks have seen a gradual rally from the 230 levels to 300 + levels with subdued volumes. The trigger for this scrip will be the 200 day SMA ( indicated by the blue line in the graphic ), which if surpassed with high volumes will indicate a buy. The oscillators are signalling a strength in the undertone and the outlook is positive in the near term.
Your call of action -
-
Investors / cash segment players - Buy for delivery on declines to the 295 - 300 levels and hold with a stop loss at the 280 levels. Once a crossover above the 320 levels is achieved, expect profit taking at the 335 - 340 levels in the near / medium term.
-
Aggressive F&O traders - buy the October futures above the 320 levels with a stop loss at the 302 mark. Expect to book profits at the 340 - 345 levels in a firm market before the expiry of the October series. Options players need to wait as the October series are not liquid as yet.
-
Derivatives contract size - Market lot = 800 shares, F&O margins = approx Rs 42,000 ( subject to change daily )
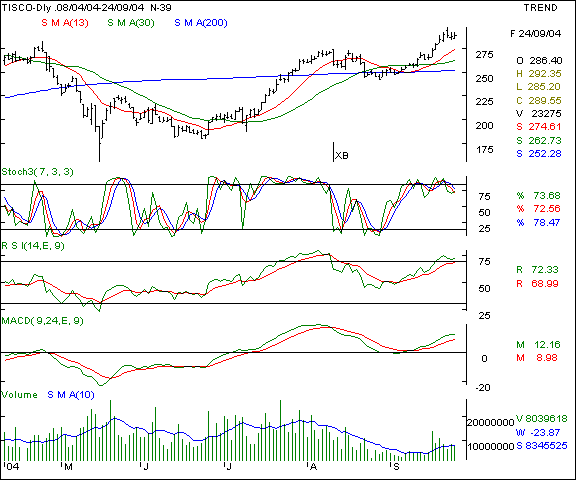
Tisco - This steel major is showing signs of bucking the cautious trend in the markets as of now and the outlook is positive as the pre result build up of positions is likely to be the highest on this counter. The F&O positions in the last 6 months have shown the counter to be the top most futures open interest candidate and a traders favourite. The recent fall has failed to breach the 200 day SMA and that is a sign of strength in the near term. The recent bar reversal on Wednesday ( Sept 22 2004 ) will be the immediate resistance above which the stock will turn bullish. A breakout above the 297 will trigger a buy, especially if the traded volumes are in excess of 90 lac shares on the NSE.
Your call of action -
-
Investors / cash segment players - Buy above the 297 mark and hold with a stop loss at the 288 levels. Expect profit taking at the 314 and 320 in the short and medium term respectively in a conducive market.
-
Aggressive F&O traders - Buy the October futures above the 296 levels and hold with a stop loss at the 291 levels. Expect profit taking at the 308 levels in the near term in a positive market.
-
Derivatives contract size - Market lot = 1350 shares. F&O margin = approx Rs 66,000 (subject to change daily )
|
Indices - domestic |
BSE Sensex - this BSE benchmark index is showing a classic movement in the bullish channel and the retracement has also come at the channel top which makes this channel an accurate forecasting tool for traders. According to technical parameters, as long as the scrip / index remains in the upper half of the channel, the outlook remains bullish. Keeping that view in mind, we feel the 5410 levels need to watched for support. That level is a 200 day SMA as well as the mid way mark of the channel and a critical level to watch. We feel a slight consolidatory fall to the 5450 is likely in the near term before the markets show a secular trend formation again.
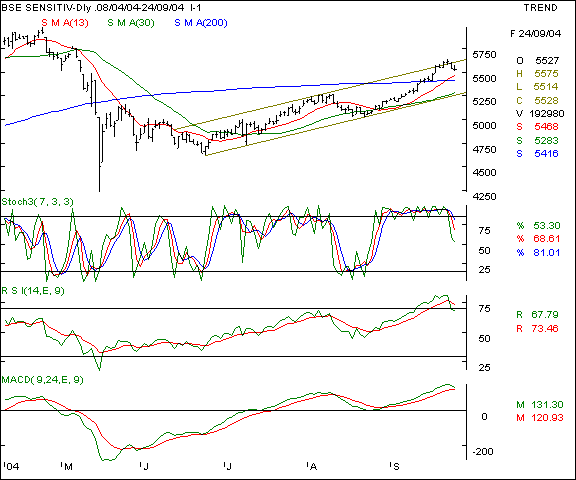
Your call of action - Since the Sensex futures are not very liquid, we suggest trading the Nifty 50 instead.
Nifty 50 - The Nifty is showing a similar movement as the Sensex and a perfect resistance at the channel top is seen on the index. The 200 day SMA is at the 1710 levels and the meaningful support is at the 1680 levels, below which the index should not fall in the coming week if the uptrend is expected to continue. The chances of a corrective fall are slightly higher than an outright upmove in the coming week.
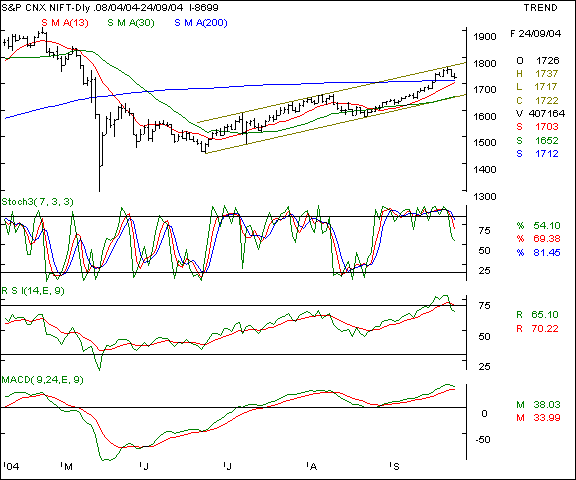
Your call of action - Short the Nifty Oct futures with an extremely short term perspective if the cash prices fall below the 1710 levels. Hold with a Rs 10-12 stop loss and expect profit taking at the 1690 levels. On the upsides, expect the resistance to be seen at the 1764 levels in the coming week, beyond which a new upmove can commence.
|
Indices - international |
Dow Jones Industrial Average - The Dow has fallen as we had forecast last week and has been unable to hold on to it's gains above the channel top. That is a sign of weakness in the immediate future and the 10,000 levels will be the psychological barrier to watch out for in the near term. The upsides are likely to be capped at the 10,200 levels and the downsides will be 9820 if the 10,000 breaks with higher volumes.
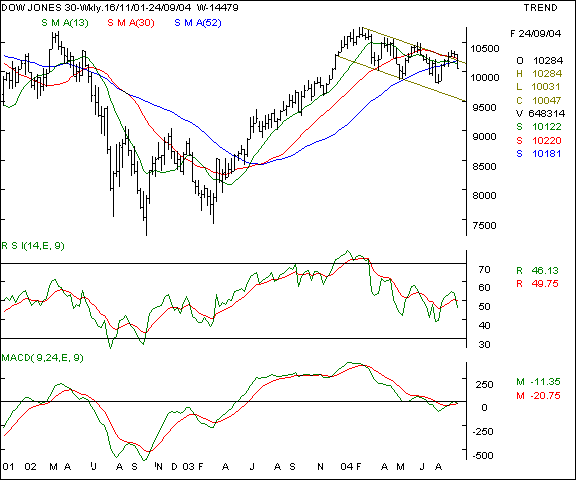
Your call of action - Since Indian investors are not allowed to trade in overseas markets, this is a pure academic study.
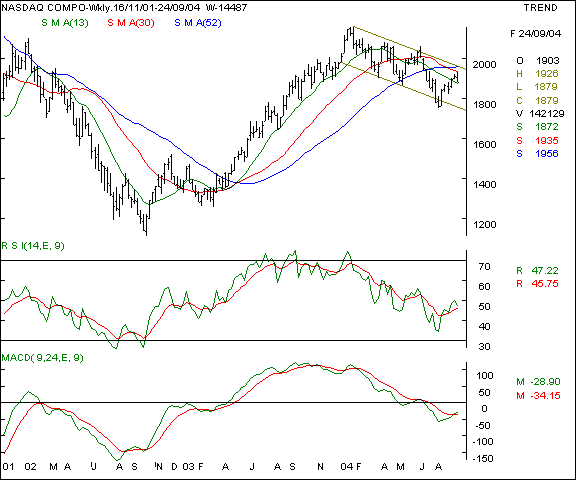
Nasdaq - The Nasdaq has been moving within the bearish channel plotted on the graph and the effective resistance on the upside will be at the 1955 levels and the support on the downside will be at the 1822 levels in the coming week. The outlook remains cautious as the upsides are likely to see profit sales ahead of the earnings season and bulls are expected to offload long positions on advances.
Your call of action - Since Indian investors are not allowed to trade in overseas markets, this is a pure academic study.
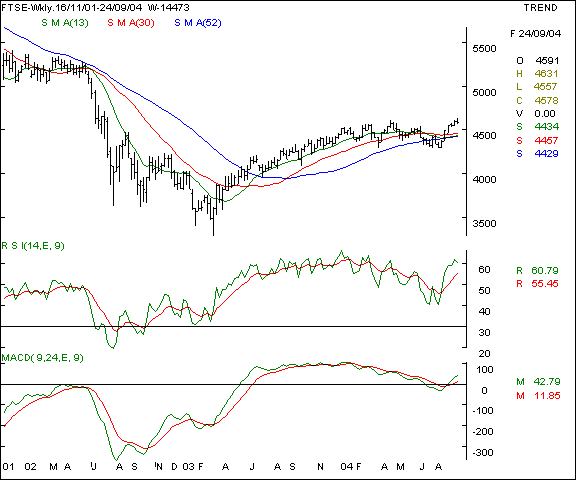
FTSE - this UK index is showing higher relative strength as compared to it's USA counter parts but the upsides will be capped at the 4650 which will be the immediate hurdle. On the lower side, we expect support at the 4450 levels in the coming week.
Your call of action - Since Indian investors are not allowed to trade in overseas markets, this is a pure academic study.
|
Trading tips for the week |
-
The put / call ratio is climbing and is currently at the 0.56 : 1 levels and the outstanding positions in the derivatives segment have shown a marginal increase ahead of expiry. The FII investments are continuing steadily. The outlook remains optimistic for now.
-
There is offloading at higher levels in stock futures. That indicates a cautious approach as long positions in individual stocks is being hedged by Nifty shorts.
-
The current week is crucial for the markets as the expiry of the September series will see short covering or rolling over of these shorts. That will determine the immediate trend of the markets.
-
Trades must be executed in small volumes due to the higher volatility expected. Trade fewer counters and conserve cash for future opportunities.
-
The October 01 deadline for securities transaction tax and the new tax regime will be the immediate trigger for the markets as marginal selling pressure maybe seen from tax sensitive players. Traded volumes may be impacted in the absolute short term, so aggressive trading positions are best avoided.
-
Standby for fresh recommendations via SMS on a real - time basis.
- Have a profitable week.
- Vijay L Bhambwani
- Ceo :- Bsplindia.com
The author is a Mumbai based investment consultant and invites feedback at Vijay@BSPLindia.com and ( 022 ) 23438482 / 23400345.
SEBI disclosure :- The author has no positions in any securities mentioned above.
- While all due care has been taken while in compiling the data enclosed herein, we cannot be held responsible for errors, if any, creeping in. Please consult an independent qualified investment advisor before taking investment decisions. This mail is not sent unsolicited, and only advisory in nature. We have accepted no consideration from any company mentioned above and recommend taking decisions on merits of the stocks from our viewpoint. This email is being sent to you as a paid subscriber. Please protect your interests and ours by not disclosing the contents to any un-authorised person/s
Legal notice :- The Professional Ticker Reader is a trademark of Bhambwani Securities (P) Ltd. and any un-authorised replication / duplication in part or full will be infringing our trademark and will result in legal action being enforced on the infringing persons / parties.