Global market indices - weekly feature - Aug 23, 2003
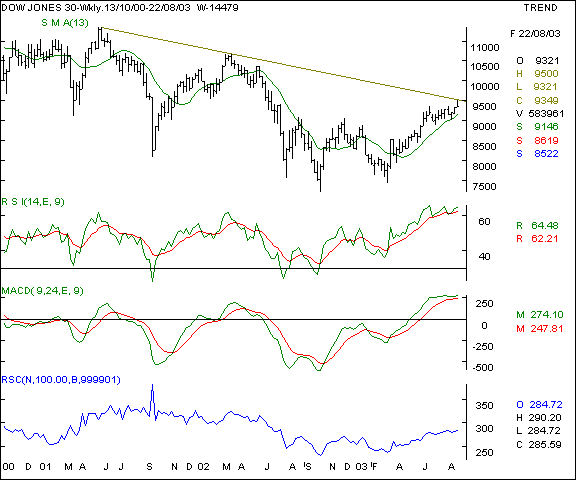
Dow Jones Industrial Average - This old economy benchmark index measures the outlook on the New York stock exchange. Last week we advocated that should the Dow close above the 9380 mark, expect the index to test the 9500 levels. That forecast has been proved accurate as the Dow has indeed made an intraweek top at the 9500 levels. The downward sloping trendline is being tested for resistance and should the Dow manage to close above the 9360 for a few consecutive sessions, we expect a minor breakout upwards.
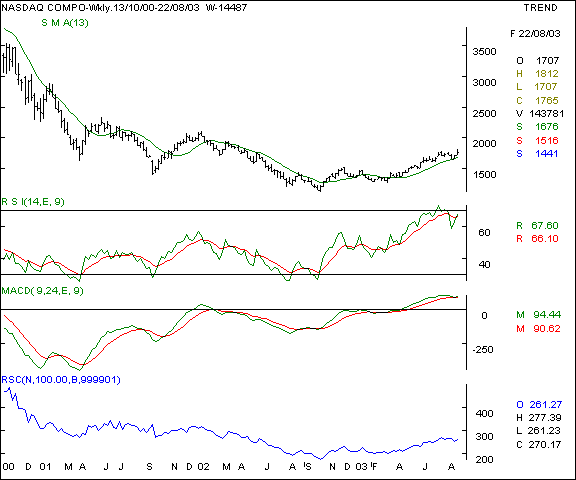
Your call of action - Since Indian investors are not allowed to trade in overseas markets, this is a pure academic study. Nasdaq - This new economy benchmark index measures the outlook on the Nasdaq exchange. Last week, we had advocated that the Nasdaq should not close below the 1684 levels or it would turn bearish. The worst seems to be over for this index as it has cleared a short term congestion and attempted to make a new high. The feel-good-factor is likely to percolate to the domestic software counters which were showing signs of revival last week. It is crucial that the Nasdaq trade higher than the 1782 levels consistently to signal a fresh run upwards. The next resistance will come at the 1865 and 1893 levels. On the lower side, expect support at the 1685 levels.
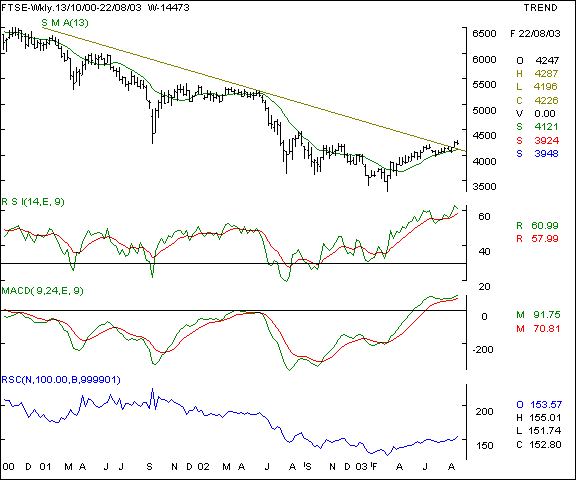
Your call of action - Since Indian investors are not allowed to trade in overseas markets, this is a pure academic study. FTSE - This index measures the outlook on the London stock exchange. The index has been making higher bottoms and tops on the weekly charts. Last week, we observed that the oscillators were signalling a possibility of higher levels in the coming weeks. That forecast has been accurate as the FTSE has broken out of the downward sloping trendline and has closed a gap left on the downside. Expect the resistance to come at the 4450 levels. On the downside, the support to watch would be 4110 levels.
Your call of action - Since Indian investors are not allowed to trade in overseas markets, this is a pure academic study. |
Your feedback is important ! Please click here to let us know your views. Click here to inform a friend about this page on our website.


