Global market indices - weekly feature - July 12, 2003
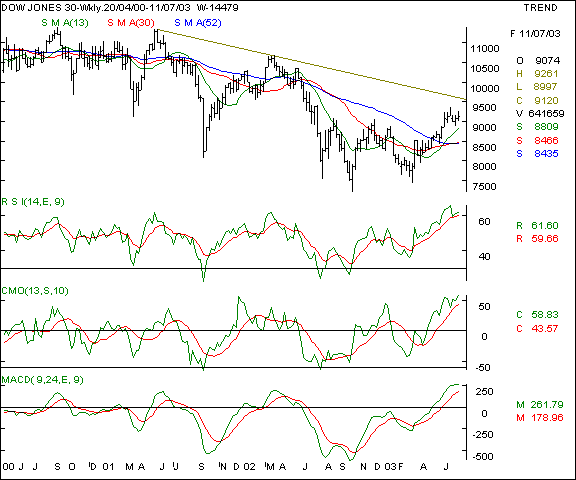
Dow Jones Industrial Average - This old economy benchmark index measures the outlook on the New York stock exchange. The index had been making higher tops and bottoms and the move was supported by the oscillators. After the Federal reserve meeting, the markets are cooling off, and likely to seek levels of 8800. Should the markets remain firm however, expect 9261 & 9352 as the next inflection points, after due corrections.
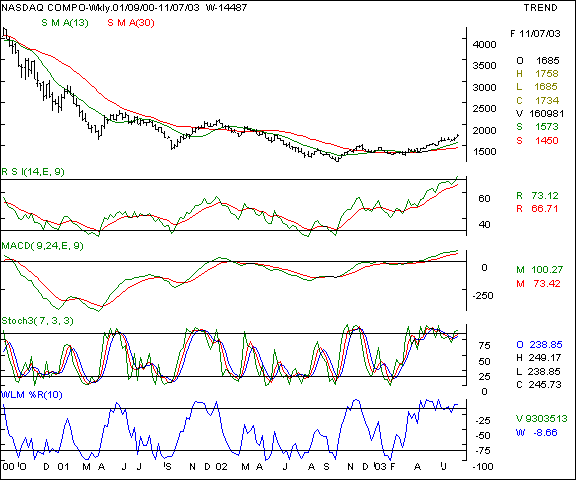
Your call of action - Since Indian investors are not allowed to trade in overseas markets, this is a pure academic study. Nasdaq - This new economy benchmark index measures the outlook on the Nasdaq exchange. The index is making a saucer formation which is supported by the oscillators. Since the last fortnight, we predicted that the 1680 levels were a crucial resistance level being the previous highs. The index has indeed flared higher above this resistance !! Watch this resistance level closely as the violated resistance is now a support on the downside. As was accurately predicted by us last week, above a convincing close of 1685 for 2-3 sessions, expect the Nasdaq to see 1725 - 1730 levels by the weekend. The Nasdaq has indeed closed at the 1734 levels !! We also said that it will have a positive impact for the domestic software counters too, as was seen in the last weeks trades. Watch the 1785 levels on the Nasdaq for fresh selling points. The Nasdaq is likely to out-perform the Dow Jones Industrial average.
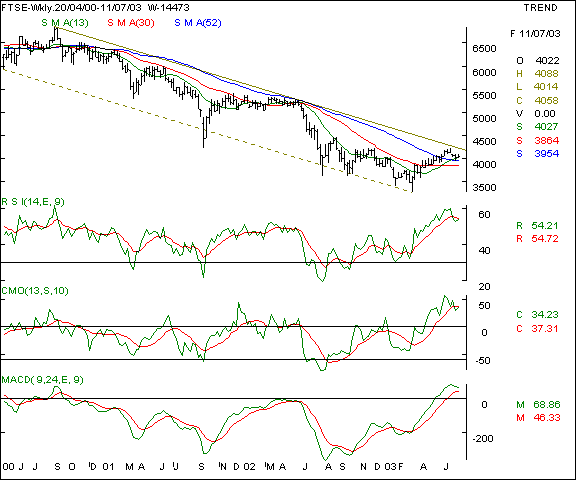
Your call of action - Since Indian investors are not allowed to trade in overseas markets, this is a pure academic study. FTSE - This index measures the outlook on the London stock exchange. The index has been making higher bottoms and tops on the weekly charts. Last week, we observed that the index has been unable to surpass the downward sloping channel. That resistance point is 4280 which the FTSE must surpass. In the coming week, our investors must watch these levels. On the downside, the support to watch would be 3890 levels.
Your call of action - Since Indian investors are not allowed to trade in overseas markets, this is a pure academic study. |
Your feedback is important ! Please click here to let us know your views. Click here to inform a friend about this page on our website.


