Global market indices - weekly feature - April 11, 2004
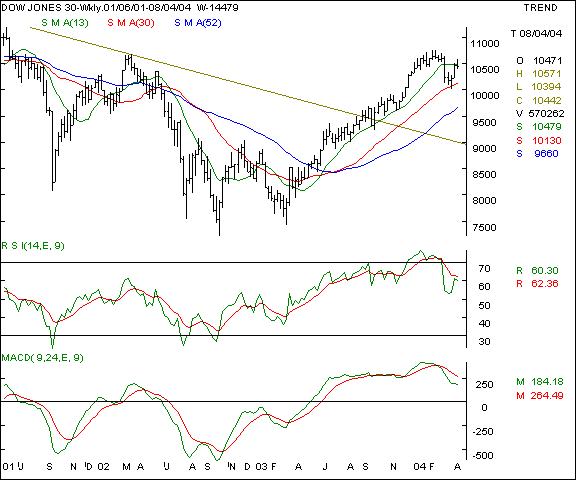
Dow Jones Industrial Average - This old economy benchmark is showing a bar reversal signal as the closing is lower than the opening levels. The 10,570 levels therefore becomes the effective short term top for the markets in the near term. The downward support is likely at the 10,200 levels and the maximum upside in the absolute near term is the 10,700 - 10,750 mark. The outlook in the coming week is that of consolidation.
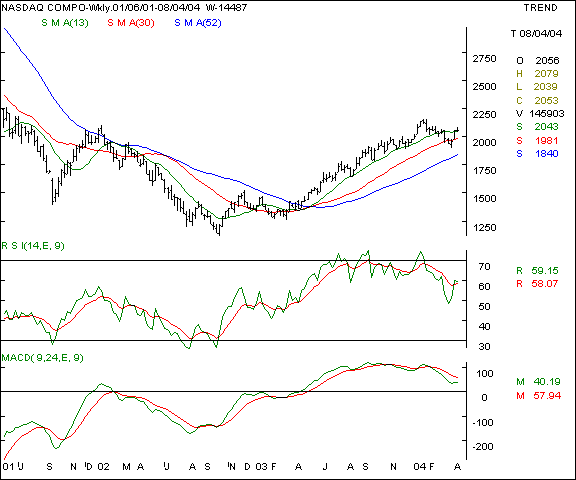
Your call of action - Since Indian investors are not allowed to trade in overseas markets, this is a pure academic study. Nasdaq - This new economy benchmark is showing higher relative strength than the Dow Jones index. The 1990 levels will be a good support in the coming week with the 2120 as the immediate resistance. Watch this index for immediate trend determination of the domestic technology counters.
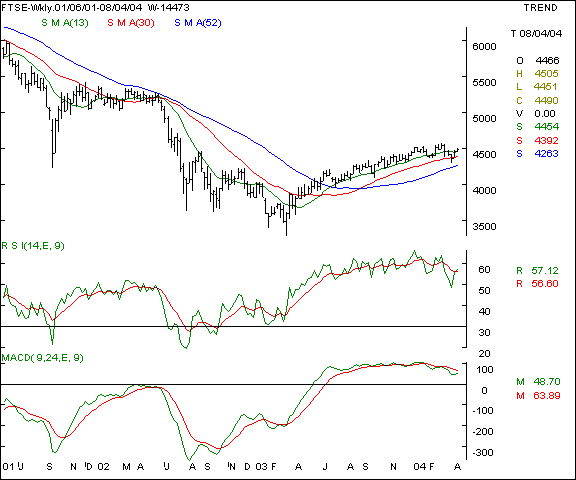
Your call of action - Since Indian investors are not allowed to trade in overseas markets, this is a pure academic study. FTSE - This UK index is showing a steady consolidation trend as the 30 week SMA being the immediate support for the index at the 4400 levels. The 4640 is the coming weeks resistance point where selling is likely. The outlook is mildly positive for this index in the coming week.
Your call of action - Since Indian investors are not allowed to trade in overseas markets, this is a pure academic study. |
Your feedback is important ! Please click here to let us know your views. Click here to inform a friend about this page on our website.


