Global market indices - weekly feature - Aug 29, 2004
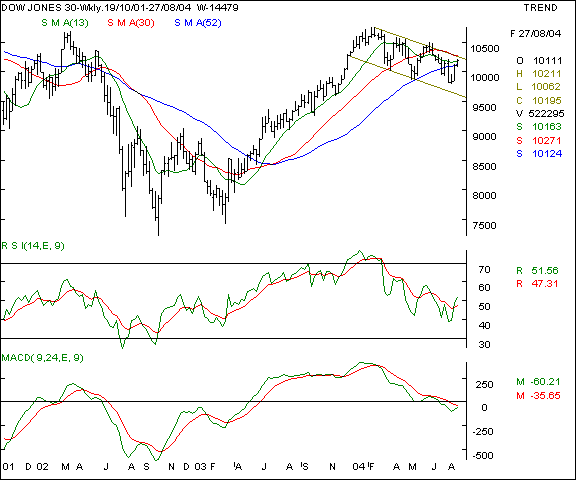
Dow Jones Industrial Average - this NYSE benchmark is moving in a bearish channel and near it's short term resistance at the 10,275 mark. The index has risen for the second week in a row and the upmove is accompanied by poor volumes. An interesting chart pattern is underway and the same will be confirmed only above the 10,320 levels which will turn the outlook to positive in the near term. Expect 10110 to be the immediate support.
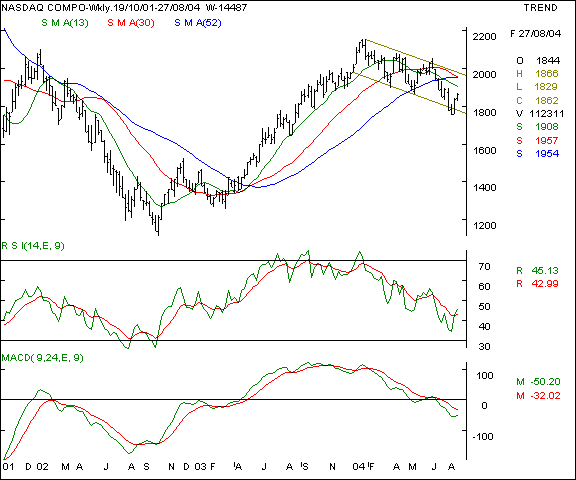
Your call of action - Since Indian investors are not allowed to trade in overseas markets, this is a pure academic study. Nasdaq - This technology laden index is showing a similar pattern like the Dow Jones, only that this index is relatively weaker. The 1920 levels will be the crucial resistance to watch for now and lower support will come at the 1788 levels. Any close above the 1900 mark will boost the domestic technology stocks in the short term.
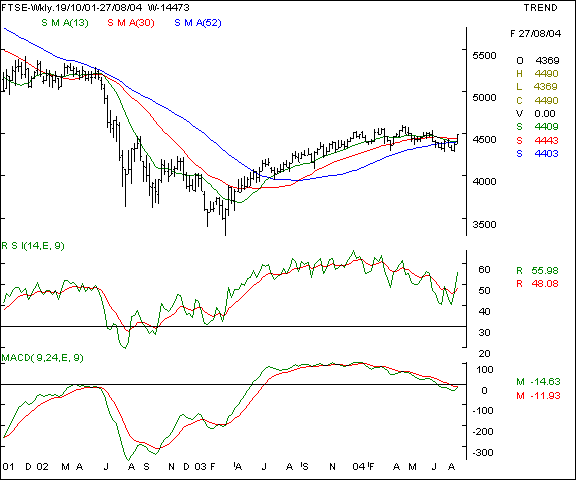
Your call of action - Since Indian investors are not allowed to trade in overseas markets, this is a pure academic study. FTSE - This index is showing signs of an upward breakout and higher relative strength as compared to the US indices. The coming week will see the test of the upmove and whether the same is sustainable or not. Any close above the 4620 will be a sign of strength. On the lower side, any close below the 4350 mark will see weakness.
Your call of action - Since Indian investors are not allowed to trade in overseas markets, this is a pure academic study. |
Your feedback is important ! Please click here to let us know your views. Click here to inform a friend about this page on our website.


