Global market indices - weekly feature - May 17, 2004
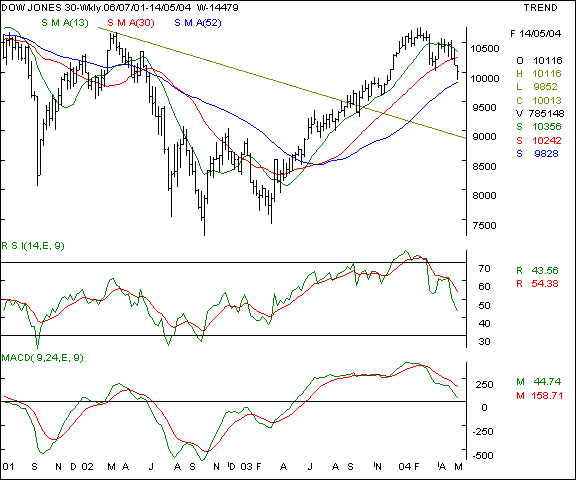
Dow Jones Industrial Average - the US old economy benchmark is in a bearish grip as the short and medium term averages are violated and the index is on the threshold of a long term average support. The oscillators are clearly pointing towards a fall and the immediate base is at the 9830 levels. On the higher side, expect the 10300 levels to be a resistance. Should the 9830 be violated, expect a rapid fall.
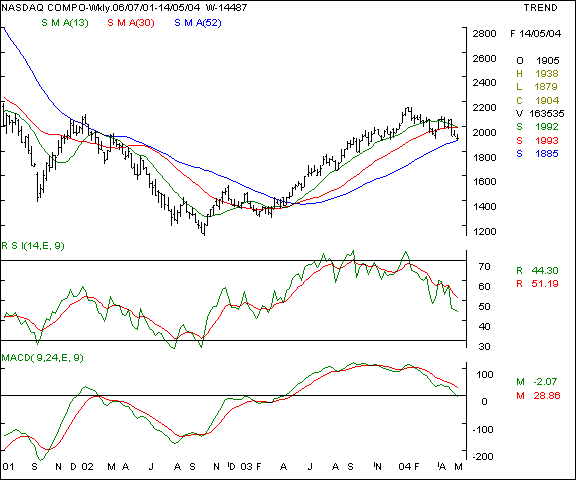
Your call of action - Since Indian investors are not allowed to trade in overseas markets, this is a pure academic study. Nasdaq - this index measures the new economy sentiments and is under similar pressure as the Dow Jones. The momentum oscillators are in a sell mode and all rallies are likely to be met with offloading by nervous bulls. We feel the outlook is extremely weak below the 1875 levels. On the higher side, we expect the 1990 levels to be a resistance in the near term.
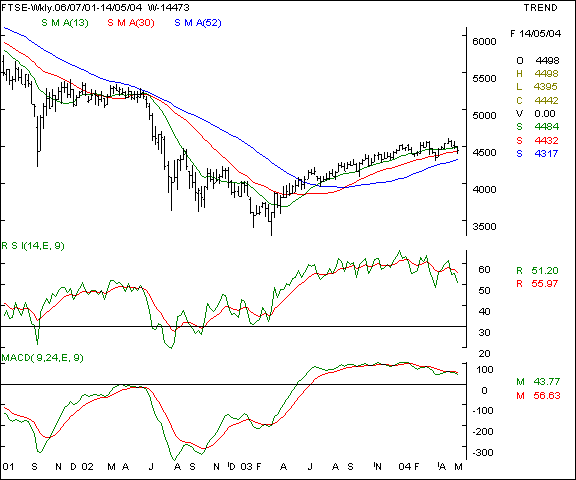
Your call of action - Since Indian investors are not allowed to trade in overseas markets, this is a pure academic study. FTSE - This UK index is showing higher relative strength as compared to the US indices. Support to watch is the 4300 levels and resistance is at the 4600 levels.
Your call of action - Since Indian investors are not allowed to trade in overseas markets, this is a pure academic study. |
Your feedback is important ! Please click here to let us know your views. Click here to inform a friend about this page on our website.


