Global market indices - weekly feature - Sept 26, 2004
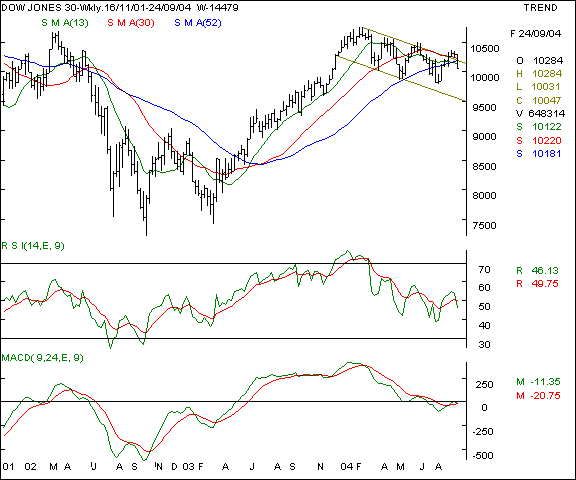
Dow Jones Industrial Average - The Dow has fallen as we had forecast last week and has been unable to hold on to it's gains above the channel top. That is a sign of weakness in the immediate future and the 10,000 levels will be the psychological barrier to watch out for in the near term. The upsides are likely to be capped at the 10,200 levels and the downsides will be 9820 if the 10,000 breaks with higher volumes.
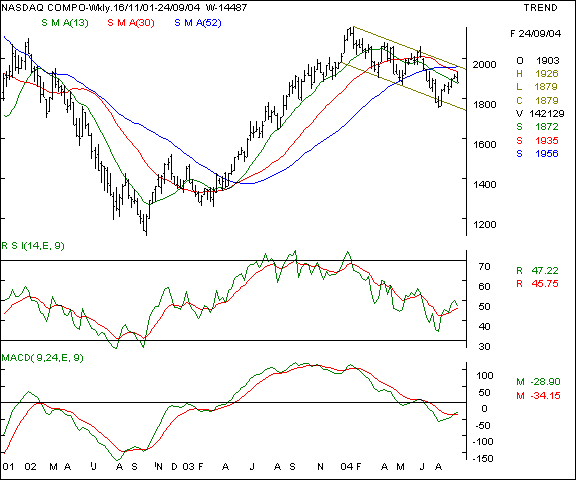
Your call of action - Since Indian investors are not allowed to trade in overseas markets, this is a pure academic study. Nasdaq - The Nasdaq has been moving within the bearish channel plotted on the graph and the effective resistance on the upside will be at the 1955 levels and the support on the downside will be at the 1822 levels in the coming week. The outlook remains cautious as the upsides are likely to see profit sales ahead of the earnings season and bulls are expected to offload long positions on advances.
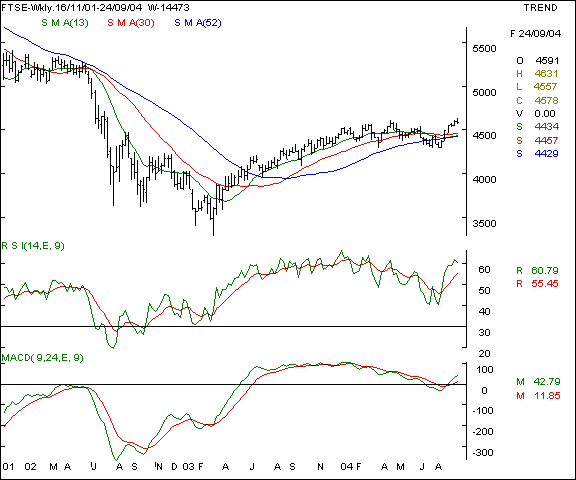
Your call of action - Since Indian investors are not allowed to trade in overseas markets, this is a pure academic study. FTSE - this UK index is showing higher relative strength as compared to it's USA counter parts but the upsides will be capped at the 4650 which will be the immediate hurdle. On the lower side, we expect support at the 4450 levels in the coming week.
Your call of action - Since Indian investors are not allowed to trade in overseas markets, this is a pure academic study |
Your feedback is important ! Please click here to let us know your views. Click here to inform a friend about this page on our website.


