Dow
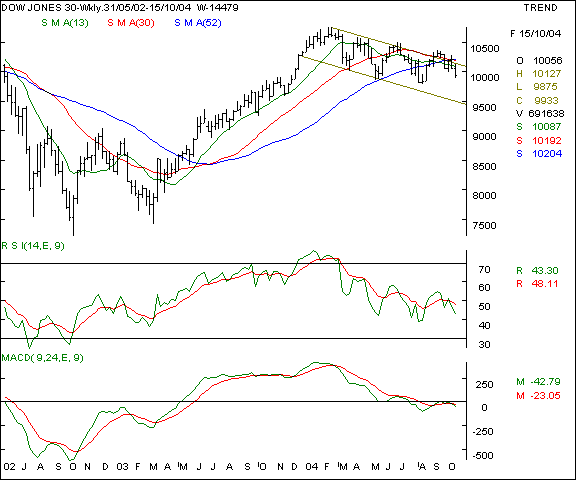
Jones Industrial Average - as forecast by us last week, this
NYSE index has been unable to hold on to gains and displayed a lower tops
and bottoms formation. The channel top has proven to be a formidable
resistance and the 52 week average could not be surpassed. The 10085
levels will be the near term resistance and support is likely at the 9780
levels

Your
call of action - Since Indian
investors are not allowed to trade
in overseas markets, this is a pure
academic study.
Nasdaq
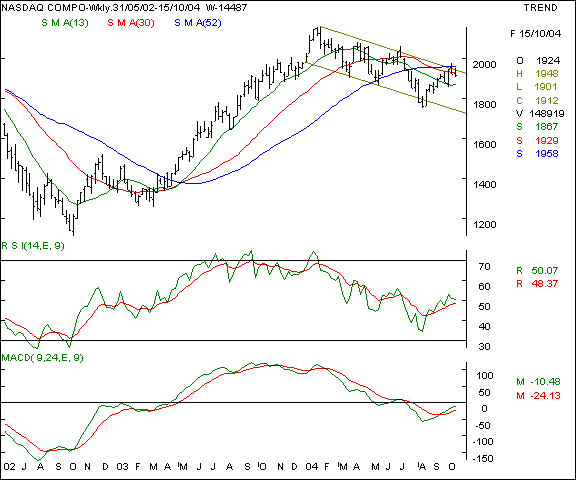
- this technology / biotech laden index also displays a similar chart
pattern as the Dow Jones, though the level of attrition is less. The index
has been making lower tops and bottoms formations and the is unable to
trade above it's 52 week SMA. The immediate support is likely at the 1870
levels and the resistance at the 1960 mark

Your
call of action - Since Indian
investors are not allowed to trade
in overseas markets, this is a pure
academic study.
FTSE
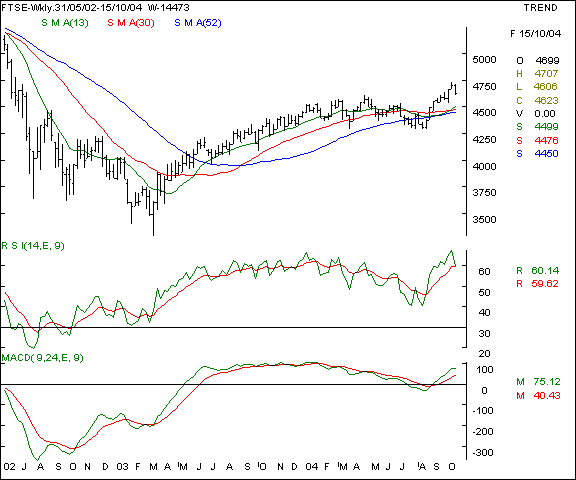
- this UK index had shown promise in the last fortnight, but flattered to
deceive as the markets could not hold onto their gains. The 4750 levels
become the immediate top in the coming days and 4520 the immediate
support.

Your
call of action - Since Indian
investors are not allowed to trade
in overseas markets, this is a pure
academic study.